📊 Updated Snapshot
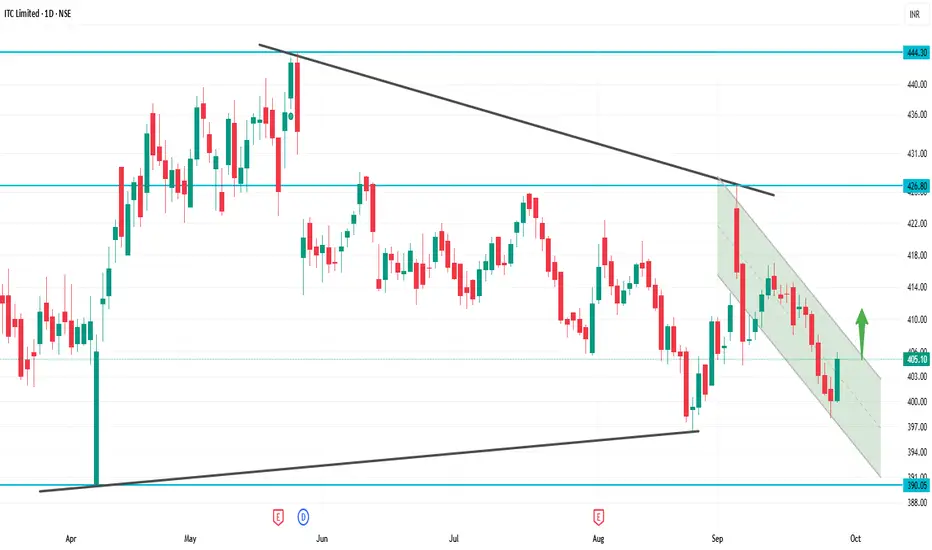
Current Price: ~₹405
Day Range: ₹402 – ₹410
52-Week High: ₹499
52-Week Low: ₹399
📈 Technical Outlook
Support Zones:
Strong support at ₹405 (current zone)
Next support at ₹398
Resistance Zones:
Immediate resistance at ₹410–₹416
Next resistance at ₹421
Trend Bias: Weak bearish → stock is near 52-week low, testing crucial support.
📌 Step-by-Step View
If it holds above ₹405–₹398: Buyers may step in, possible bounce toward ₹416–₹421.
If it breaks below ₹398: More downside risk opens, weakness can extend further.
Upside revival only above ₹421 closing: That will change trend toward bullish.
相關出版品
免責聲明
這些資訊和出版物並非旨在提供,也不構成TradingView提供或認可的任何形式的財務、投資、交易或其他類型的建議或推薦。請閱讀使用條款以了解更多資訊。