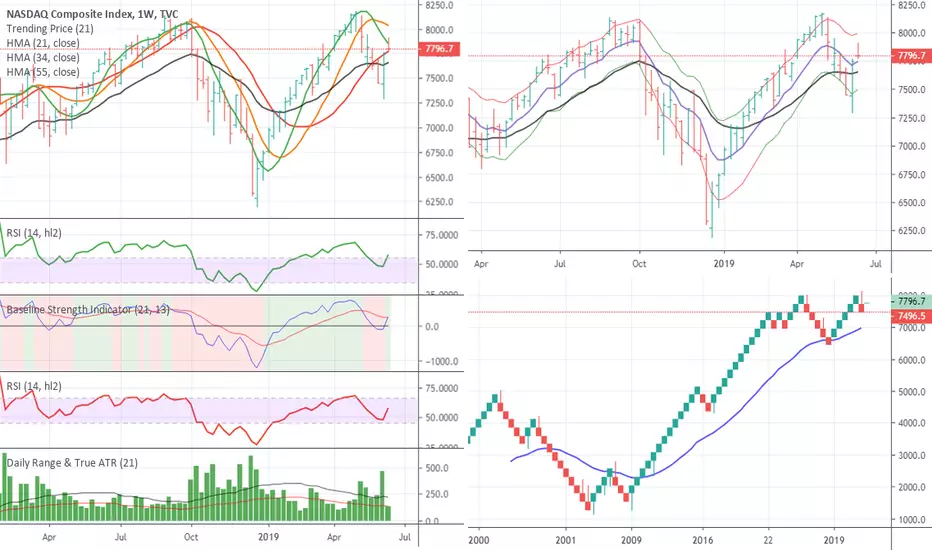
NASDAQ stalled last week, the 8 MA has nearly caught up with prices on the daily charts.
Weekly chart has consolidation between 7292.2(S) - 8135.5(R).
A trigger formed on the baseline and currently reflects enough strength to indicate an attempt to break out to ~8178.5
This isn't a strong trigger - so once the breakout occurs "holding" the position and advancing will be determined by strength at that point.
免責聲明
這些資訊和出版物並不意味著也不構成TradingView提供或認可的金融、投資、交易或其他類型的意見或建議。請在使用條款閱讀更多資訊。
免責聲明
這些資訊和出版物並不意味著也不構成TradingView提供或認可的金融、投資、交易或其他類型的意見或建議。請在使用條款閱讀更多資訊。