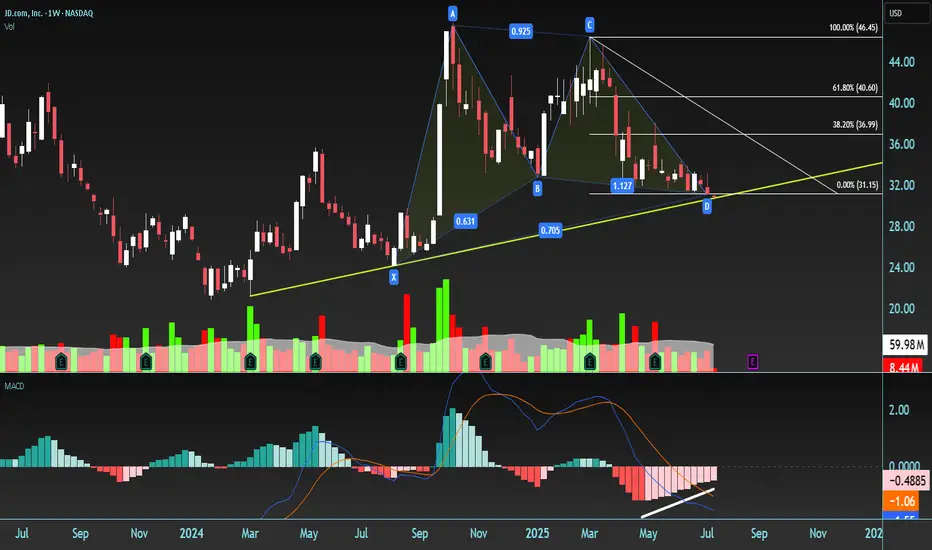
Potential Bullish Gartley pattern has formed with the following structure: XABCD.
initial low X = 23.45 , Price rallies to point A, then forms a corrective structure down to
D = 30.71 trough BCD. CD leg is downward, completing the pattern.
Despite the decline, point D is higher than X, suggesting a bullish setup. The area around D (30.71) is identified as a Potential Reversal Zone (PRZ).
Confluences Supporting a Long Entry
1. Gartley Completion at PRZ
Point D lies near the 78.6% Fibonacci retracement of the XA leg — a typical Gartley completion level.
2. Rising Support Trend Line
D is aligned with a yellow ascending trend line, reinforcing it as a potential bounce area.
3. MACD Bullish Divergence
Price makes a lower low into D, while MACD forms a higher low, signaling bullish momentum divergence.
Trade Plan
* Enter long after confirmation via a strong bullish candle*(e.g., bullish engulfing, hammer)
* Preferably accompanied by above-average volume
Stop Loss:
* Place stop just below point D (30.71)
* Allow a small buffer (e.g., 1–2% below) to account for noise
Targets – Fibonacci Retracement of CD Leg:
1. Target 1 – 38.2%
2. Target 2 – 61.8%
3. Target 3 – 78.6%
4. Target 4 – 100% (full retracement of CD)
Risk Management:
* Use appropriate position sizing (e.g., risk only 1–2% of total capital)
* Consider trailing the stop as targets are hit to lock in profits
免責聲明
這些資訊和出版物並非旨在提供,也不構成TradingView提供或認可的任何形式的財務、投資、交易或其他類型的建議或推薦。請閱讀使用條款以了解更多資訊。