STOCK TREND - BULLISH
MULTI TF ANALYSIS
==================
MONTHLY - ATH breakout
WEEKLY - Ascending Triangle breakout with Marubozu candle
DAILY - RTS breakout
TECHNICAL ANALYSIS
===================
Stock Price is trading above [50, 100, 200] SMAs
RSI > [60]
VOLUME > [20] MA
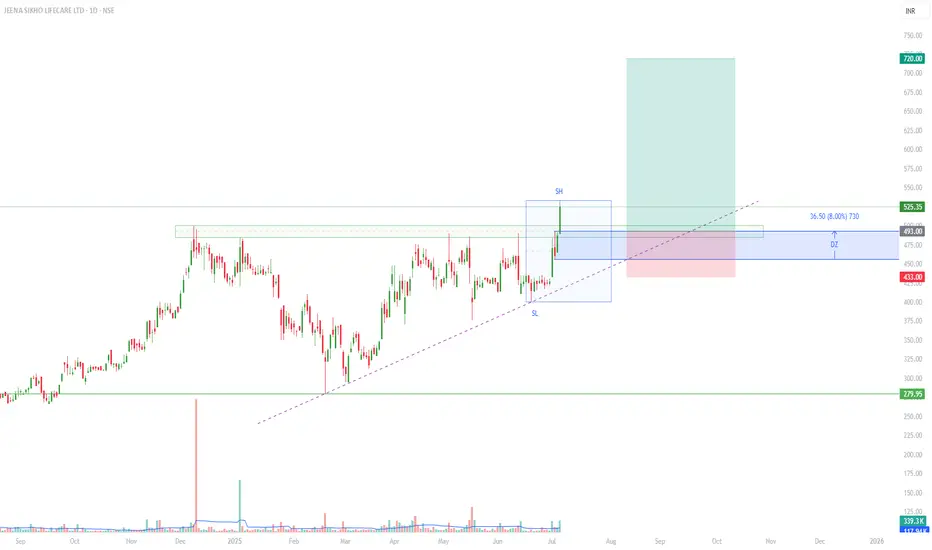
Support/Resistance Zone - [420.20 - 499.70]
Demand Zone - [456.50 - 493]
Observation - Breakout has been confirmed along with RSI and Volume confirmation on daily chart. We shall expect price to cpme back to the DZ at the confluence of Resistance turned Support and Trendline.
FUNDAMENTAL ANALYSIS
======================
Compounded Sales Growth - [45%]
Compounded Profit Growth - [34%]
Stock Price CAGR - [136%]
Return on Equity - [39%]
Note: The stock is currently little overvalued as Stock PE(71.97) > Industry PE(34.3).
TRADE DESIGN
=============
ENTRY - [493]
SL - [433]
TARGET - [720]
RRR - [1:3.78]+
Disclaimer: This chart study is for educational purpose only. Kindly trade at your own risk.
免責聲明
這些資訊和出版物並非旨在提供,也不構成TradingView提供或認可的任何形式的財務、投資、交易或其他類型的建議或推薦。請閱讀使用條款以了解更多資訊。
免責聲明
這些資訊和出版物並非旨在提供,也不構成TradingView提供或認可的任何形式的財務、投資、交易或其他類型的建議或推薦。請閱讀使用條款以了解更多資訊。