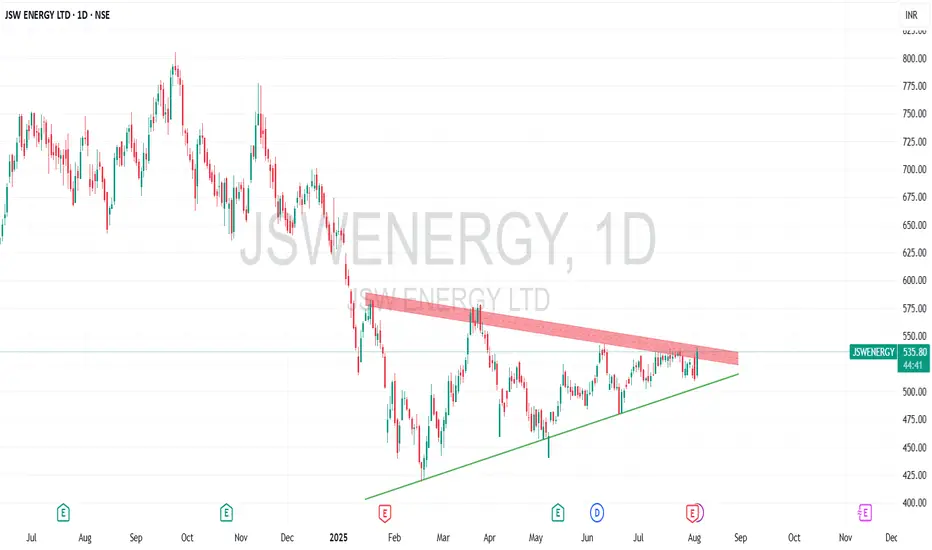
🔍Technical Analysis
JSW Energy remained range-bound below ₹120–₹130 from 2010–2020, briefly dipping to ₹40 post-COVID. It surged to ₹400 by October 2021, pulled back to ₹200 during the second COVID wave, then rallied past ₹400 in September 2023 and reached ₹800 by September 2024. A crash back to ₹400 followed.
In 2025, the stock formed a symmetrical triangle — a consolidation pattern featuring higher lows and lower highs. Recently, it reported solid Q1 FY26 results, boosting bullish sentiment. A breakout above the triangle signals a fresh move upward.
Entry Strategy: Only enter on a confirmed breakout above the pattern.
Targets:
Target 1: ₹600
Target 2: ₹650
Target 3: ₹700
Stop Losses:
Minor Stop: ₹480 (just below triangle)
Major Stop: ₹400 (strong demand zone)
Breach of these zones would invalidate the bullish thesis.
💰Q1 FY26 Financial Highlights (vs Q4 FY25 & Q1 FY25)
- Total Income: ₹5,143 Cr (↑ +61% QoQ vs ₹3,189 Cr; ↑ +79% YoY vs ₹2,879 Cr)
- Total Expenses: ₹2,355 Cr (↑ +19% QoQ vs ₹1,985 Cr; ↑ +61% YoY vs ₹1,462 Cr)
- Operating Profit: ₹2,789 Cr (↑ +132% QoQ vs ₹1,204 Cr; ↑ +97% YoY vs ₹1,418 Cr)
- Profit Before Tax: ₹1,015 Cr (↑ +181% QoQ vs ₹361 Cr; ↑ +45% YoY vs ₹698 Cr)
- Profit After Tax: ₹836 Cr (↑ +101% QoQ vs ₹415 Cr; ↑ +57% YoY vs ₹534 Cr)
- Diluted EPS: ₹4.25 (↑ +82% QoQ vs ₹2.33; ↑ +42% YoY vs ₹2.99)
🧠Fundamental Highlights
Q1 PAT surged ~102% QoQ and ~57% YoY owing to better generation mix and favorable power tariffs.
Capable of handling ~215 GW of power generation capacity; demand remains stable.
Reported ₹4,833 Cr in cash flows and reduced debt/equity from 1.9× to 1.5×.
Interim dividend declared — ₹0.50/share.
Expansion pipeline includes EV charging infra and solar capacities under JV.
✅Conclusion
JSW Energy shows a clear technical breakout opportunity, backed by robust Q1 results and performance momentum. A confirmed breakout above ₹500 can set the stage toward ₹700. Stay alert to stops at ₹480 and ₹400 to manage risk.
Disclaimer:lnkd.in/gJJDnvn2
免責聲明
這些資訊和出版物並不意味著也不構成TradingView提供或認可的金融、投資、交易或其他類型的意見或建議。請在使用條款閱讀更多資訊。
免責聲明
這些資訊和出版物並不意味著也不構成TradingView提供或認可的金融、投資、交易或其他類型的意見或建議。請在使用條款閱讀更多資訊。
