Buonasera a tutti!!

Hello everyone,
sharing my technical analysis on LINKUSDT's current corrective structure following the recent impulse wave that set a new local high (and quarterly high).
## The Analysis
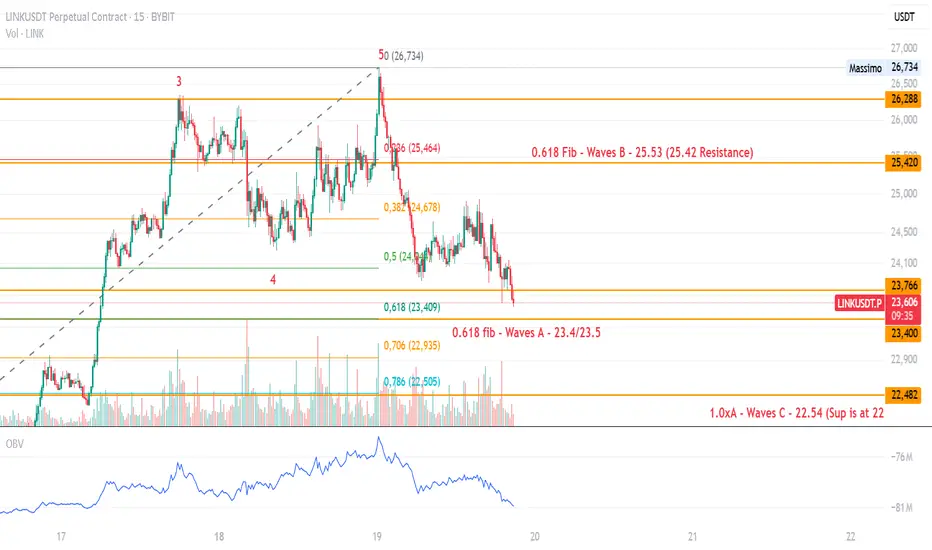
After completing an extended Wave 3, which broke the previous August 13th high and pushed the price towards the $27 mark, LINK has entered a classic A-B-C corrective phase.
Wave A: This first leg down appears to be completing its internal Zigzag (5-3-5) structure. The natural target for this initial bearish impulse lies within the key support zone of $23.4 - $23.5. The price has already reacted near $23.6, suggesting the local bottom is close.
Wave B: Once Wave A is complete, a corrective bounce is expected. The most probable target for this Wave B relief rally is the resistance area around $25.4, which aligns perfectly with the 0.618 Fibonacci retracement of Wave A.
Wave C: After Wave B concludes, the final leg of the correction, Wave C, should follow. The projected target for this wave, based on a 1.0x extension of Wave A, is the strong support level at $22.48.
## A Potential Trading Strategy
Based on this Elliott Wave map, a potential trading plan could be:
Wait for Wave A to Complete: Avoid opening new short positions now that the target for Wave A is near.
Trade the Wave B Bounce: Look for a conservative long entry upon confirmation that Wave B has started, placing a Stop Loss below the Wave A low (e.g., below the $23.7 support).
Trade the Wave C Decline: Take profit on the long position near the Wave B target (~$25.4) and, upon signs of weakness, consider a short entry to ride the final corrective wave down to its ultimate target.
Disclaimer: This is a technical analysis and not financial advice. Please trade according to your own strategy and risk management.
Hello everyone,
sharing my technical analysis on LINKUSDT's current corrective structure following the recent impulse wave that set a new local high (and quarterly high).
## The Analysis
After completing an extended Wave 3, which broke the previous August 13th high and pushed the price towards the $27 mark, LINK has entered a classic A-B-C corrective phase.
Wave A: This first leg down appears to be completing its internal Zigzag (5-3-5) structure. The natural target for this initial bearish impulse lies within the key support zone of $23.4 - $23.5. The price has already reacted near $23.6, suggesting the local bottom is close.
Wave B: Once Wave A is complete, a corrective bounce is expected. The most probable target for this Wave B relief rally is the resistance area around $25.4, which aligns perfectly with the 0.618 Fibonacci retracement of Wave A.
Wave C: After Wave B concludes, the final leg of the correction, Wave C, should follow. The projected target for this wave, based on a 1.0x extension of Wave A, is the strong support level at $22.48.
## A Potential Trading Strategy
Based on this Elliott Wave map, a potential trading plan could be:
Wait for Wave A to Complete: Avoid opening new short positions now that the target for Wave A is near.
Trade the Wave B Bounce: Look for a conservative long entry upon confirmation that Wave B has started, placing a Stop Loss below the Wave A low (e.g., below the $23.7 support).
Trade the Wave C Decline: Take profit on the long position near the Wave B target (~$25.4) and, upon signs of weakness, consider a short entry to ride the final corrective wave down to its ultimate target.
Disclaimer: This is a technical analysis and not financial advice. Please trade according to your own strategy and risk management.
免責聲明
這些資訊和出版物並非旨在提供,也不構成TradingView提供或認可的任何形式的財務、投資、交易或其他類型的建議或推薦。請閱讀使用條款以了解更多資訊。