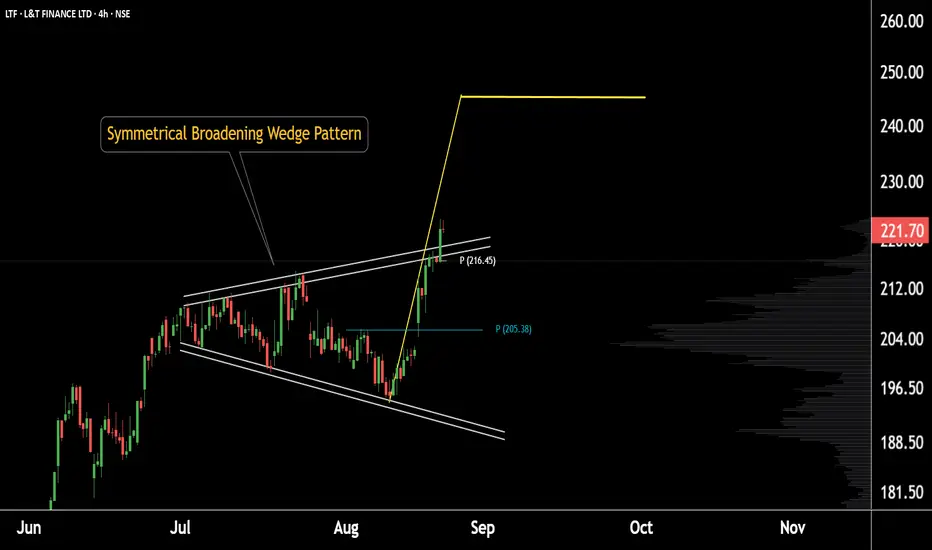
This is the daily chart of L&T Finance.
The stock has been forming a broadening wedge pattern and has recently given a pattern breakout around 220.
Currently, L&T Finance is sustaining above its daily pivot level of 216, with strong support in the 215–220 zone.
If this support holds, we may witness higher prices in the stock.
Thank you.
The stock has been forming a broadening wedge pattern and has recently given a pattern breakout around 220.
Currently, L&T Finance is sustaining above its daily pivot level of 216, with strong support in the 215–220 zone.
If this support holds, we may witness higher prices in the stock.
Thank you.
@RahulSaraoge
Connect us at t.me/stridesadvisory
Connect us at t.me/stridesadvisory
免責聲明
這些資訊和出版物並不意味著也不構成TradingView提供或認可的金融、投資、交易或其他類型的意見或建議。請在使用條款閱讀更多資訊。
@RahulSaraoge
Connect us at t.me/stridesadvisory
Connect us at t.me/stridesadvisory
免責聲明
這些資訊和出版物並不意味著也不構成TradingView提供或認可的金融、投資、交易或其他類型的意見或建議。請在使用條款閱讀更多資訊。