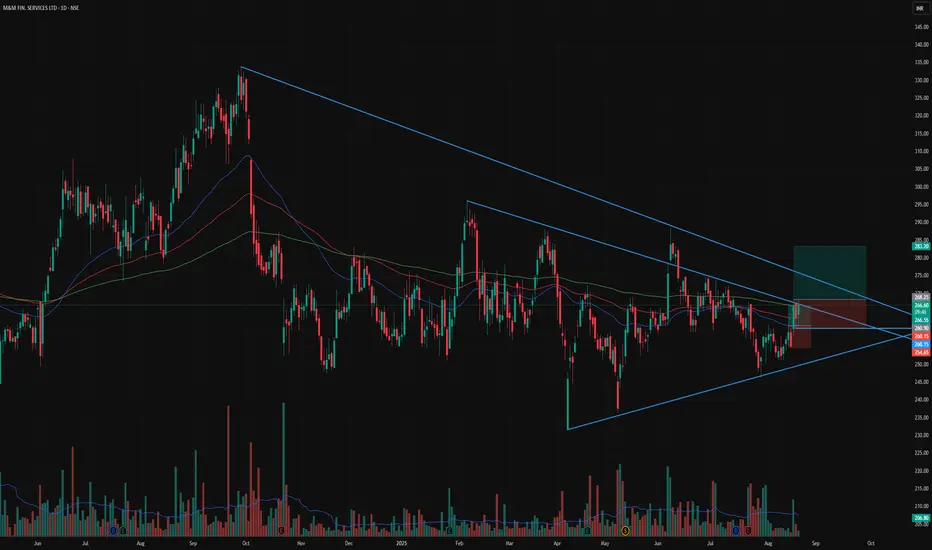
📊 Stock: M&M Financial Services (M&MFIN)
🔹 Symmetrical triangle pattern forming – price squeezing into apex
🔹 Strong bounce from lower trendline with rising volume
🔹 Trading above 50 DMA & 100 DMA – short-term trend improving
🔹 200 DMA resistance near ₹268–270 being tested
🔹 RSI showing strength
🔹 Good support zone at ₹250–255
🔹 Strong financial backing as part of M&M Group
⚡ Price nearing breakout zone (₹268–270)
🚀 Breakout above 268 can trigger a rally towards ₹283–300
⚠️ Support at ₹250 – below this trend may weaken
免責聲明
這些資訊和出版物並非旨在提供,也不構成TradingView提供或認可的任何形式的財務、投資、交易或其他類型的建議或推薦。請閱讀使用條款以了解更多資訊。
免責聲明
這些資訊和出版物並非旨在提供,也不構成TradingView提供或認可的任何形式的財務、投資、交易或其他類型的建議或推薦。請閱讀使用條款以了解更多資訊。