📝 Description:
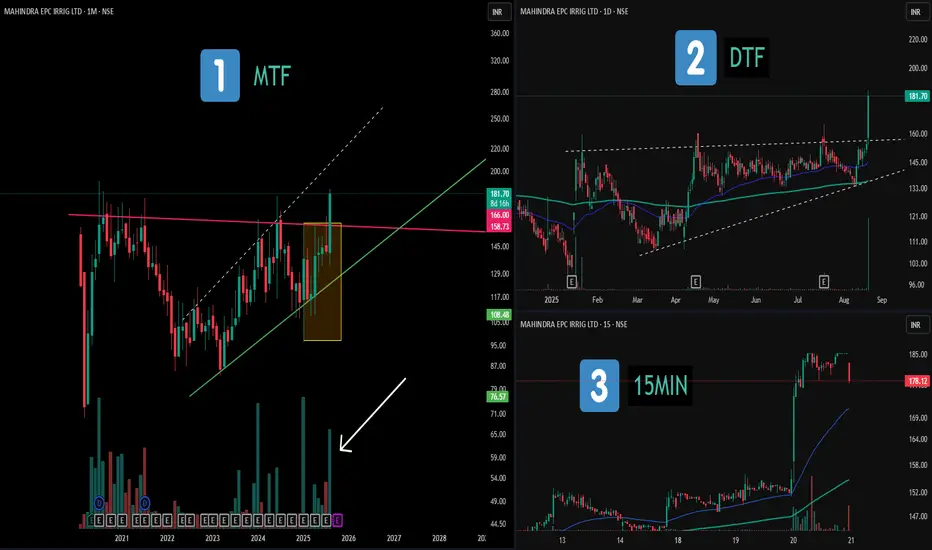
1️⃣ MTF (Monthly) – Displays a broad consolidation structure with a hidden broadening formation and notable volume clusters marked in recent candles.
2️⃣ DTF (Daily) – Highlights an ascending triangle structure, with clear range boundaries and price compression before expansion.
3️⃣ 15MIN (Intraday) – Shows that the maximum price movement and volume activity occurred on a single candle, illustrating how momentum often concentrates in short bursts.
This chart setup serves as an educational view across multiple timeframes, showing how higher- and lower-TF structures can align.
⚠️ Disclaimer:
This post is purely for educational and structural analysis purposes. Not financial advice.
🎯 Master My Self-Made Trading Strategy
📈 Telegram (Learn Today): t.me/hashtaghammer
✅ WhatsApp (Learn Today): wa.me/919455664601
📈 Telegram (Learn Today): t.me/hashtaghammer
✅ WhatsApp (Learn Today): wa.me/919455664601
相關出版品
免責聲明
這些資訊和出版物並非旨在提供,也不構成TradingView提供或認可的任何形式的財務、投資、交易或其他類型的建議或推薦。請閱讀使用條款以了解更多資訊。