MANA - Observation: Will History Repeat Itself?
Analyzing the weekly chart of MANA, we can see that the price has reacted sharply around key levels.
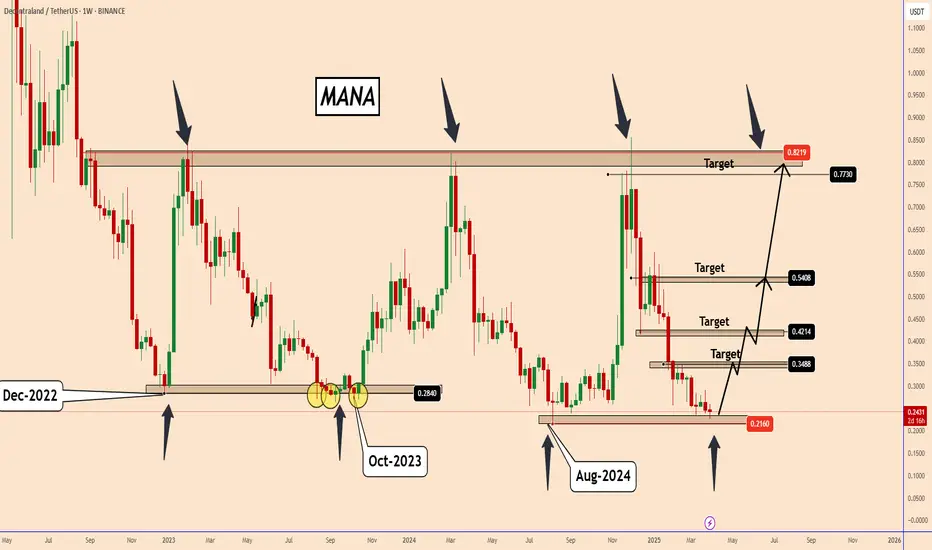
Since December 2022, MANA has been moving within a broad trading range, fluctuating between 0.2200 and 0.8200.
Looking at past price movements, MANA rose from 0.2800 in December 2022. When tested again in October 2023, it dipped slightly below this zone before rebounding strongly. A similar pattern emerged in August 2024, where the price dropped just below the October 2023 level, then surged back up to test the upper boundary near 0.8200.
Given this repeating behavior, the chart suggests that the price may follow a similar pattern this time.
You may find more details in the chart!
Thank you and Good Luck!
❤️PS: Please support with a like or comment if you find this analysis useful for your trading day❤️
Analyzing the weekly chart of MANA, we can see that the price has reacted sharply around key levels.
Since December 2022, MANA has been moving within a broad trading range, fluctuating between 0.2200 and 0.8200.
Looking at past price movements, MANA rose from 0.2800 in December 2022. When tested again in October 2023, it dipped slightly below this zone before rebounding strongly. A similar pattern emerged in August 2024, where the price dropped just below the October 2023 level, then surged back up to test the upper boundary near 0.8200.
Given this repeating behavior, the chart suggests that the price may follow a similar pattern this time.
You may find more details in the chart!
Thank you and Good Luck!
❤️PS: Please support with a like or comment if you find this analysis useful for your trading day❤️
✅MY Free Signals
t.me/TradingPuzzles
✅Personal Telegram
t.me/KlejdiCuni
✅YouTube
youtube.com/@TradingPuzzles
t.me/TradingPuzzles
✅Personal Telegram
t.me/KlejdiCuni
✅YouTube
youtube.com/@TradingPuzzles
免責聲明
這些資訊和出版物並不意味著也不構成TradingView提供或認可的金融、投資、交易或其他類型的意見或建議。請在使用條款閱讀更多資訊。
✅MY Free Signals
t.me/TradingPuzzles
✅Personal Telegram
t.me/KlejdiCuni
✅YouTube
youtube.com/@TradingPuzzles
t.me/TradingPuzzles
✅Personal Telegram
t.me/KlejdiCuni
✅YouTube
youtube.com/@TradingPuzzles
免責聲明
這些資訊和出版物並不意味著也不構成TradingView提供或認可的金融、投資、交易或其他類型的意見或建議。請在使用條款閱讀更多資訊。