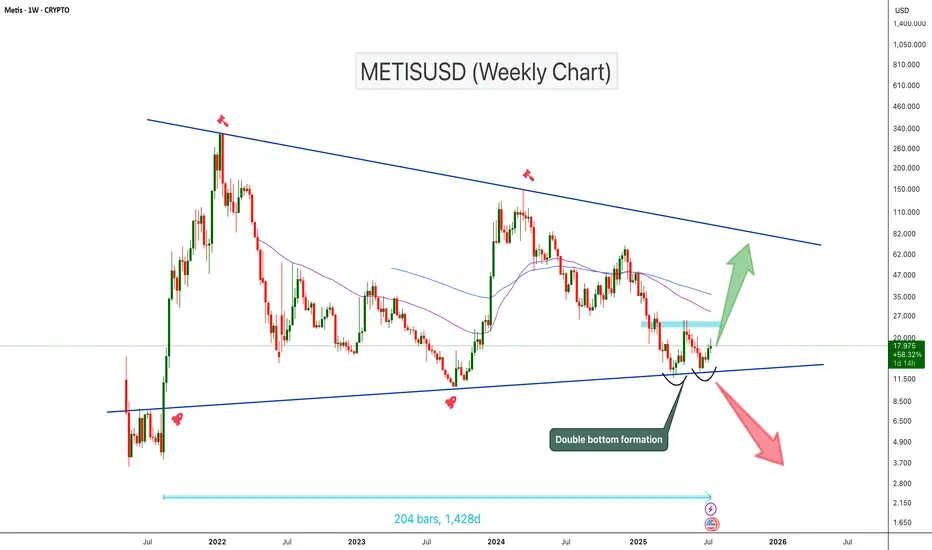
METISUSD has been trading inside a symmetrical triangle for the past 1,400 days. The price is currently sitting at the triangle support and forming a potential double bottom pattern. The double bottom can be confirmed once the price breaks the neckline resistance zone. If the price breaks this key resistance zone, we could expect a 100%–250% bullish move toward the triangle’s upper resistance
Cheers
Hexa🧘♀️

 METISUSDT MMETIS
Cheers
Hexa🧘♀️
🚀Telegram : t.me/hexatrades
🌐Website: hexatrades.io/
🗣️Twitter(X): twitter.com/HexaTrades
🌐Website: hexatrades.io/
🗣️Twitter(X): twitter.com/HexaTrades
相關出版品
免責聲明
這些資訊和出版物並不意味著也不構成TradingView提供或認可的金融、投資、交易或其他類型的意見或建議。請在使用條款閱讀更多資訊。
🚀Telegram : t.me/hexatrades
🌐Website: hexatrades.io/
🗣️Twitter(X): twitter.com/HexaTrades
🌐Website: hexatrades.io/
🗣️Twitter(X): twitter.com/HexaTrades
相關出版品
免責聲明
這些資訊和出版物並不意味著也不構成TradingView提供或認可的金融、投資、交易或其他類型的意見或建議。請在使用條款閱讀更多資訊。