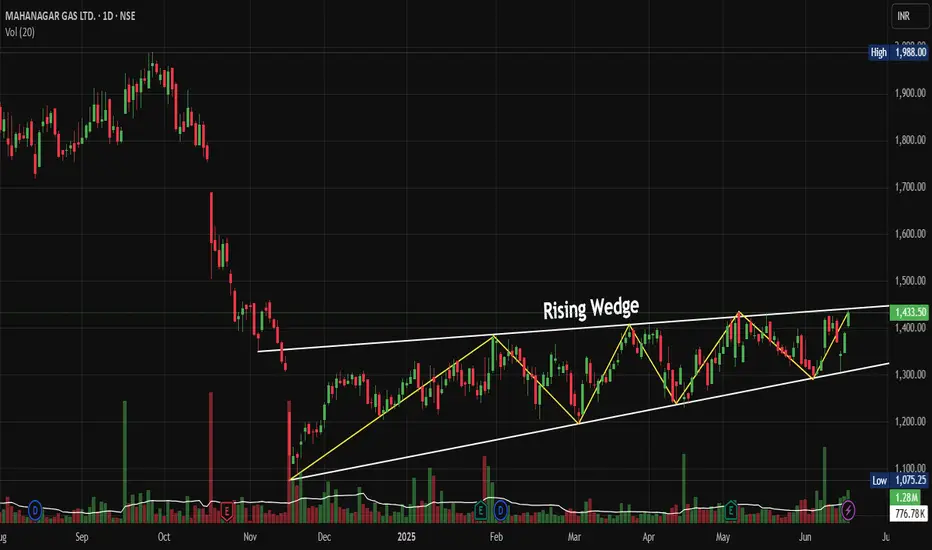
Price Action Analysis:
• Stock has formed a classic Rising Wedge pattern from November 2024 lows around 1,075 to current levels near 1,433
• The wedge shows converging trendlines with higher highs and higher lows, typical of consolidation before a breakout
• Recent breakout above the upper trendline around 1,400 levels confirms bullish momentum
• Price has rallied 33% from the wedge base, indicating strong underlying demand
Volume Spread Analysis:
• Volume spikes are visible during key breakout moments, particularly in recent sessions
• Higher volume on up days compared to down days suggests institutional accumulation
• Volume expansion during the wedge breakout confirms genuine buying interest
• Recent green volume bars indicate sustained buying pressure supporting the uptrend
Key Technical Levels:
Support Levels:
• Immediate support at 1,380-1,400 (previous resistance turned support)
• Secondary support at 1,300 (middle of the rising wedge)
• Major support at 1,200-1,250 (lower trendline of the wedge)
• Critical support at 1,075 (November 2024 lows)
Resistance Levels:
• Immediate resistance at 1,450-1,470 (psychological levels)
• Next resistance at 1,500 (round number resistance)
• Extended target at 1,600-1,650 based on wedge height projection
• 52-Week high resistance around 1,988 (historical peak)
Technical Patterns:
• Rising Wedge pattern near to completion with successful breakout
• Multiple higher highs and higher lows confirming uptrend structure
• Potential cup and handle formation on longer timeframes
• Bullish flag consolidation patterns within the broader uptrend
Trade Setup:
Entry Strategy:
• Primary entry on pullback to 1,400-1,420 levels (retest of breakout zone)
• Aggressive entry at the current market price of around 1,433 for momentum players
• Scale-in approach: 50% at 1,420, 25% at 1,380, 25% at 1,350
Exit Levels:
• First target: 1,500 (16% upside from current levels)
• Second target: 1,600 (22% upside potential)
• Extended target: 1,700-1,750 for long-term holders
• Trailing stop-loss strategy recommended above 1,500 levels
Stop-Loss Placement:
• Conservative stop-loss: 1,320 (below wedge support)
• Aggressive stop-loss: 1,380 (below immediate support)
• Risk-reward ratio of 1:2 to 1:3 depending on entry and exit points
Position Sizing and Risk Management:
• Allocate a maximum of 2-3% of the portfolio to a single position
• Use a 1% risk per trade rule based on stop-loss distance
• Consider partial profit booking at 1,500 levels
• Maintain position size discipline to avoid overexposure
Sectoral and Fundamental Backdrop:
Sector Analysis:
• City Gas Distribution (CGD) sector showing resilience amid energy transition
• The government push for clean fuel adoption, supporting the natural gas demand
• Infrastructure expansion in tier-2 and tier-3 cities benefiting CGD companies
• Regulatory environment remains supportive with steady tariff mechanisms
Fundamental Strengths:
•
• Strong cash flows from residential and industrial customer base
• Consistent dividend-paying track record with healthy payout ratios
• Robust balance sheet with minimal debt and strong return on equity
• Expanding PNG and CNG network, providing growth visibility
Key Catalysts:
• Increasing vehicle conversion to CNG, supporting volume growth
• Industrial demand recovery post-pandemic is driving commercial sales
• Government policies favouring cleaner fuel alternatives
• Potential for geographical expansion into new license areas
Risk Factors:
• Crude oil price volatility is affecting input costs
• Competition from electric vehicles in the transportation segment
• Regulatory changes in gas pricing mechanisms
• Economic slowdown impacting industrial demand
My Take:
The technical setup suggests
Keep in the Watchlist.
NO RECO. For Buy/Sell.
📌Thank you for exploring my idea! I hope you found it valuable.
🙏FOLLOW for more
👍BOOST if you found it useful.
✍️COMMENT below with your views.
Meanwhile, check out my other stock ideas on the right side until this trade is activated. I would love your feedback.
Disclaimer: "I am not a SEBI REGISTERED RESEARCH ANALYST AND INVESTMENT ADVISER."
This analysis is intended solely for informational and educational purposes and should not be interpreted as financial advice. It is advisable to consult a qualified financial advisor or conduct thorough research before making investment decisions.
相關出版品
免責聲明
這些資訊和出版物並非旨在提供,也不構成TradingView提供或認可的任何形式的財務、投資、交易或其他類型的建議或推薦。請閱讀使用條款以了解更多資訊。