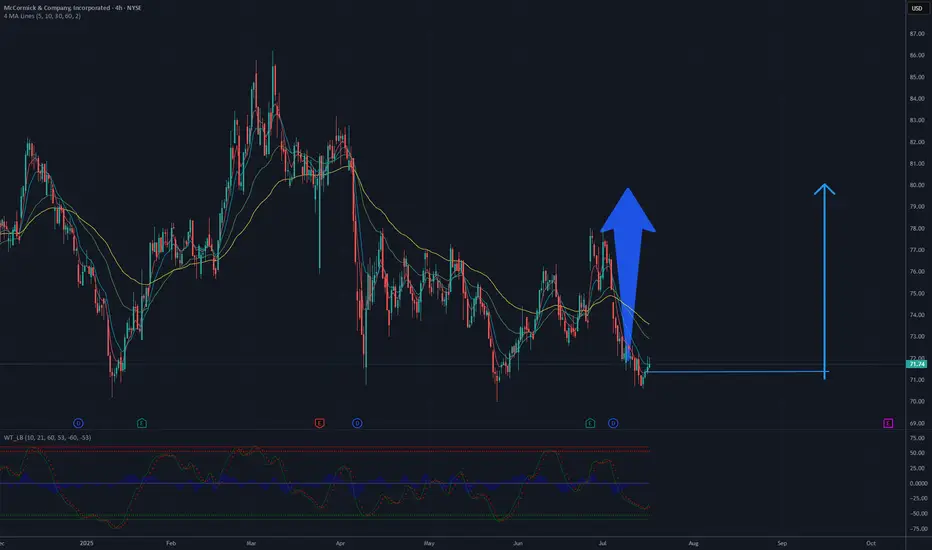
The chart analysis for this stock suggests a potential rise to 80 USD based on current technical patterns. The 4-hour chart shows a recent downtrend following a significant peak, with the price currently hovering around 71-72 USD. A key support level is evident near 70 USD, which could serve as a foundation for a potential rebound. The moving averages, including the 50-day and 200-day, indicate a prior bullish trend, and the current consolidation phase might precede another upward move.
Breaking through the resistance at 75-76 USD, a previous high, could signal the start of a new upward trend. With increased buying volume and bullish candlestick patterns, the price could target 80 USD, a notable psychological and technical resistance level. The RSI, currently in a neutral zone, could support this scenario if it begins to rise, indicating growing momentum. However, caution is advised, as a break below 70 USD support could negate this outlook and lead to further declines.
Potential TP: 80 USD
免責聲明
這些資訊和出版物並不意味著也不構成TradingView提供或認可的金融、投資、交易或其他類型的意見或建議。請在使用條款閱讀更多資訊。
免責聲明
這些資訊和出版物並不意味著也不構成TradingView提供或認可的金融、投資、交易或其他類型的意見或建議。請在使用條款閱讀更多資訊。