🔷 1. Trend and market structure
🔸 Upward channel:
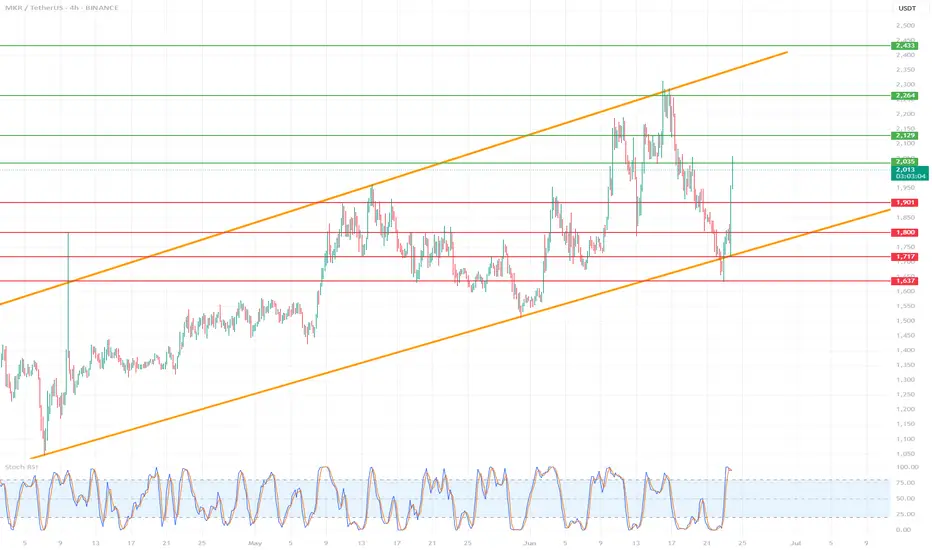
The price is moving in a wide, ascending channel (orange lines).
The lower line of the channel was last tested on June 22, 2025, which ended with a dynamic upward bounce.
The upper limit of the channel reaches around 2,450 USDT.
🕸️ Market phase:
In the short term, the market was in a downward correction phase within the uptrend.
Currently, we see a strong rebound from support - a new uptrend is possible.
🔷 2. Key horizontal levels (support/resistance)
🟥 Support:
1,637 USDT - local support (the lowest level of the red zone), almost tested at the bottom.
1,717 USDT - very technical support, tested several times.
1,800 USDT – psychological level and local consolidation.
1,901 USDT – last support peak, currently broken upwards.
🟩 Resistances:
2,003 USDT – current price level, currently tested as new resistance.
2,129 USDT – strong resistance from previous peaks.
2,264 USDT – previous swing high.
2,433 USDT – upper boundary of the channel and technical level from historical peaks.
🔷 3. Price and candle behavior
Strong demand reaction at the lower boundary of the channel: long pin bar/bull's embrace at the lower boundary.
The upward movement was dynamic and uniform, which indicates high buyer activity.
If the price stays above 1,901 USDT – further increases are possible.
🔷 4. Technical indicators
🔁 Stochastic RSI (4H):
Currently in the overbought zone, just below the level of 100 - a temporary correction or consolidation may occur.
However, with a strong upward trend, Stoch RSI may "stick" to the upper band - it does not yet give a clear S/S signal.
🔷 5. Technical scenarios
🟢 Bullish scenario (continuation of growth):
Condition: maintaining the level above 1,901 USDT.
Targets:
TP1: 2,129 USDT
TP2: 2,264 USDT
TP3: 2,433 USDT (upper limit of the channel)
Stop-loss: below 1,800 USDT
🔴 Bearish scenario (rejection of resistance):
Condition: strong rejection of 2,003 USDT and return below 1,901
Targets:
TP1: 1,800 USDT
TP2: 1,717 USDT
TP3: 1,637 USDT
SL: return above 2,003 USDT
🔷 6. Final remarks
The current upward movement looks like a "V-shape reversal" reaction - a sharp turnaround with dynamic volume suggests strong buyer interest.
The key will be the reaction to 2,003 USDT - a breakout and retest can give a very good long entry.
Short positions are risky as long as the price is in the lower half of the ascending channel.
🔸 Upward channel:
The price is moving in a wide, ascending channel (orange lines).
The lower line of the channel was last tested on June 22, 2025, which ended with a dynamic upward bounce.
The upper limit of the channel reaches around 2,450 USDT.
🕸️ Market phase:
In the short term, the market was in a downward correction phase within the uptrend.
Currently, we see a strong rebound from support - a new uptrend is possible.
🔷 2. Key horizontal levels (support/resistance)
🟥 Support:
1,637 USDT - local support (the lowest level of the red zone), almost tested at the bottom.
1,717 USDT - very technical support, tested several times.
1,800 USDT – psychological level and local consolidation.
1,901 USDT – last support peak, currently broken upwards.
🟩 Resistances:
2,003 USDT – current price level, currently tested as new resistance.
2,129 USDT – strong resistance from previous peaks.
2,264 USDT – previous swing high.
2,433 USDT – upper boundary of the channel and technical level from historical peaks.
🔷 3. Price and candle behavior
Strong demand reaction at the lower boundary of the channel: long pin bar/bull's embrace at the lower boundary.
The upward movement was dynamic and uniform, which indicates high buyer activity.
If the price stays above 1,901 USDT – further increases are possible.
🔷 4. Technical indicators
🔁 Stochastic RSI (4H):
Currently in the overbought zone, just below the level of 100 - a temporary correction or consolidation may occur.
However, with a strong upward trend, Stoch RSI may "stick" to the upper band - it does not yet give a clear S/S signal.
🔷 5. Technical scenarios
🟢 Bullish scenario (continuation of growth):
Condition: maintaining the level above 1,901 USDT.
Targets:
TP1: 2,129 USDT
TP2: 2,264 USDT
TP3: 2,433 USDT (upper limit of the channel)
Stop-loss: below 1,800 USDT
🔴 Bearish scenario (rejection of resistance):
Condition: strong rejection of 2,003 USDT and return below 1,901
Targets:
TP1: 1,800 USDT
TP2: 1,717 USDT
TP3: 1,637 USDT
SL: return above 2,003 USDT
🔷 6. Final remarks
The current upward movement looks like a "V-shape reversal" reaction - a sharp turnaround with dynamic volume suggests strong buyer interest.
The key will be the reaction to 2,003 USDT - a breakout and retest can give a very good long entry.
Short positions are risky as long as the price is in the lower half of the ascending channel.
免責聲明
這些資訊和出版物並不意味著也不構成TradingView提供或認可的金融、投資、交易或其他類型的意見或建議。請在使用條款閱讀更多資訊。
免責聲明
這些資訊和出版物並不意味著也不構成TradingView提供或認可的金融、投資、交易或其他類型的意見或建議。請在使用條款閱讀更多資訊。