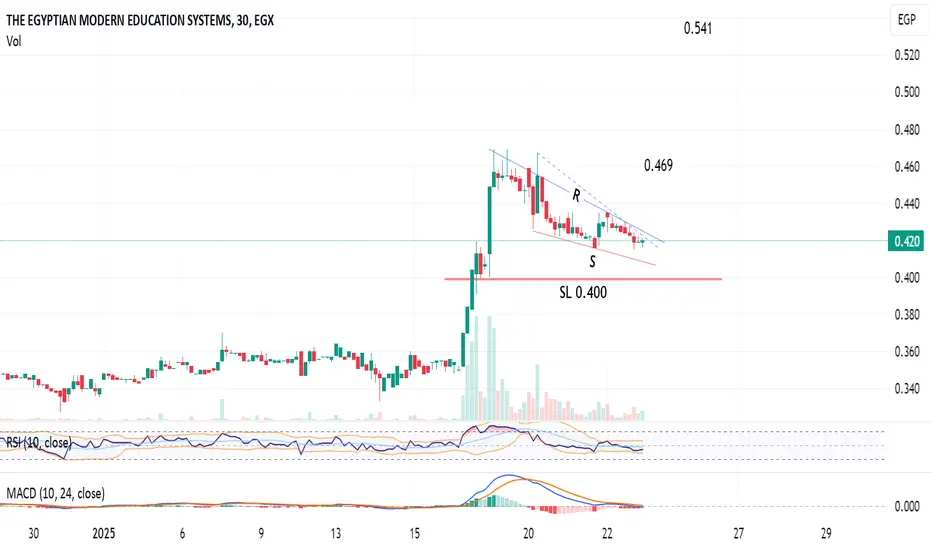
MOED Egypt has a potential for a breakout 0.469 / 0.520 / 0.541
30-min chart
The stock MOED is trading in a falling wedge between R and S lines, and may form a bigger pennant pattern.
We need a confirmation, after closing 3 candles above 0.425, then the target will be 0.469
Above 0.470 for 3 candles, the next target will be 0.520 - extended to 0.541
Consider a near stop loss - and note the important support line at 0.400
The stock
We need a confirmation, after closing 3 candles above 0.425, then the target will be 0.469
Above 0.470 for 3 candles, the next target will be 0.520 - extended to 0.541
Consider a near stop loss - and note the important support line at 0.400
免責聲明
這些資訊和出版物並不意味著也不構成TradingView提供或認可的金融、投資、交易或其他類型的意見或建議。請在使用條款閱讀更多資訊。