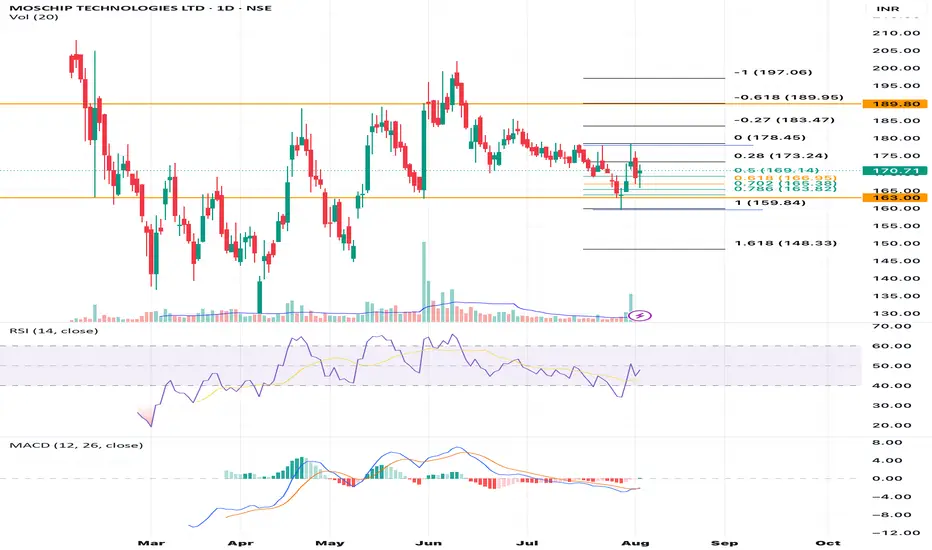
Here’s a technical analysis of the MOSCHIP TECHNOLOGIES LTD (NSE: MOSCHIP) daily chart using the visible price action, Fibonacci retracement levels, RSI, MACD, and volume:
⸻
🔍 Price Action & Fibonacci Levels
• Current Price: ₹170.71 (+1.22%)
• Price is at/near the 0.618 Fibonacci retracement level (~₹170.14), which often acts as a strong support/resistance.
• The price recently bounced off the ₹163.00 support zone (1.0 Fib), showing buying interest.
• Resistance levels ahead:
• ₹173.24 (0.28 Fib)
• ₹178.45 (0.0 Fib)
• ₹183.47 (-0.27 Fib)
• ₹189.80 (-0.618 Fib) — a major resistance zone.
⸻
📊 Volume Analysis
• A noticeable volume spike on the latest candle suggests strong participation (possibly institutional), indicating a potential short-term trend reversal or breakout.
⸻
💹 RSI (Relative Strength Index)
• RSI is around 50, indicating neutral momentum.
• It has bounced from below 40 recently, suggesting emerging bullish momentum.
• Not yet overbought — room for further upside if momentum continues.
⸻
📉 MACD (Moving Average Convergence Divergence)
• MACD and Signal Line are still below the zero line, indicating the overall trend is still bearish.
• However, the histogram is showing reducing bearish momentum (bars are getting shorter).
• A bullish crossover may be forming soon, which would support a further upward move.
⸻
📈 Summary & Outlook
Bullish Signs:
• Price rebounded from strong support at ₹163.
• Volume spike on up day — signs of accumulation.
• RSI is recovering.
• Possible bullish MACD crossover coming.
Bearish/Risk Factors:
• Price still under key resistance levels (₹173.24 & ₹178.45).
• MACD is still in bearish territory.
• Market may retest support if it fails to break ₹173-175 decisively.
⸻
🔔 Key Levels to Watch:
• Support: ₹163.00 / ₹160.14
• Resistance: ₹173.24 → ₹178.45 → ₹183.47 → ₹189.80
⸻
📝 Strategy Suggestion (Not Financial Advice):
• Bullish Bias above ₹170 with target at ₹173.24 → ₹178.45.
• Watch for breakout above ₹178.45 with strong volume for momentum trade.
• Stop-loss below ₹163 for swing trades.
⸻
🔍 Price Action & Fibonacci Levels
• Current Price: ₹170.71 (+1.22%)
• Price is at/near the 0.618 Fibonacci retracement level (~₹170.14), which often acts as a strong support/resistance.
• The price recently bounced off the ₹163.00 support zone (1.0 Fib), showing buying interest.
• Resistance levels ahead:
• ₹173.24 (0.28 Fib)
• ₹178.45 (0.0 Fib)
• ₹183.47 (-0.27 Fib)
• ₹189.80 (-0.618 Fib) — a major resistance zone.
⸻
📊 Volume Analysis
• A noticeable volume spike on the latest candle suggests strong participation (possibly institutional), indicating a potential short-term trend reversal or breakout.
⸻
💹 RSI (Relative Strength Index)
• RSI is around 50, indicating neutral momentum.
• It has bounced from below 40 recently, suggesting emerging bullish momentum.
• Not yet overbought — room for further upside if momentum continues.
⸻
📉 MACD (Moving Average Convergence Divergence)
• MACD and Signal Line are still below the zero line, indicating the overall trend is still bearish.
• However, the histogram is showing reducing bearish momentum (bars are getting shorter).
• A bullish crossover may be forming soon, which would support a further upward move.
⸻
📈 Summary & Outlook
Bullish Signs:
• Price rebounded from strong support at ₹163.
• Volume spike on up day — signs of accumulation.
• RSI is recovering.
• Possible bullish MACD crossover coming.
Bearish/Risk Factors:
• Price still under key resistance levels (₹173.24 & ₹178.45).
• MACD is still in bearish territory.
• Market may retest support if it fails to break ₹173-175 decisively.
⸻
🔔 Key Levels to Watch:
• Support: ₹163.00 / ₹160.14
• Resistance: ₹173.24 → ₹178.45 → ₹183.47 → ₹189.80
⸻
📝 Strategy Suggestion (Not Financial Advice):
• Bullish Bias above ₹170 with target at ₹173.24 → ₹178.45.
• Watch for breakout above ₹178.45 with strong volume for momentum trade.
• Stop-loss below ₹163 for swing trades.
免責聲明
這些資訊和出版物並非旨在提供,也不構成TradingView提供或認可的任何形式的財務、投資、交易或其他類型的建議或推薦。請閱讀使用條款以了解更多資訊。
免責聲明
這些資訊和出版物並非旨在提供,也不構成TradingView提供或認可的任何形式的財務、投資、交易或其他類型的建議或推薦。請閱讀使用條款以了解更多資訊。
