Fundamental Analysis
Financial Performance
Key Product Challenges
Growth Highlights
Pipeline and Innovation
Dividend Profile
Technical Analysis
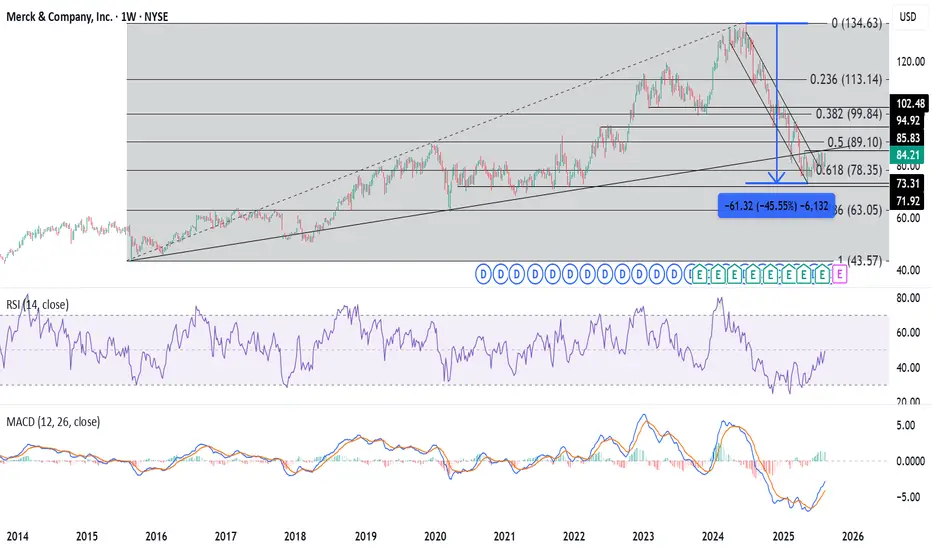
The stock price has fallen by over 45% from its ATH of $134.63 in June 2024. The price seems to be consolidating within the range of $74-$86 from April 2025. Moreover, the consolidation seems to be coinciding with the trendline support and 0.618 retracement level at $78.35 of the price rise from $43.57 in August 2015 to $134.63 in June 2024. Further, the daily RSI is just above 60, indicating that a rebound may be near the corner.
Entry: Above $86
Targets: $94.92, $99.84, and $102.48.
Stop Loss: $78.35-$77.
Financial Performance
- Revenue Decline: Q2 revenue fell 2% year-over-year to $15.8 billion.
- Earnings Drop: Adjusted earnings per share decreased by 7% to $2.13.
Key Product Challenges
- Keytruda Competition: Facing increased competition for its top cancer drug, Keytruda.
- Patent Cliff: Keytruda’s patent expiration looms in 2028, posing a revenue risk.
Growth Highlights
- Winrevair Success: New pulmonary arterial hypertension drug generated $336 million in sales post-approval last year, with blockbuster potential.
- Animal Health Segment: Sales rose 11% year-over-year to $1.6 billion, showcasing strength in a leading segment.
Pipeline and Innovation
- Subcutaneous Keytruda: Aced phase 3 studies, extending patent protection.
- Pipeline Expansion: Enhanced through licensing agreements, including promising cancer and weight loss therapies.
- Innovation Potential: Likely to develop new therapies to offset Keytruda revenue risks.
Dividend Profile
- Forward Yield: Offers a 3.85% forward dividend yield.
- Dividend Growth: Increased dividends by 39% over the past five years.
- Investment Appeal: Remains attractive for dividend-seeking investors.
Technical Analysis
The stock price has fallen by over 45% from its ATH of $134.63 in June 2024. The price seems to be consolidating within the range of $74-$86 from April 2025. Moreover, the consolidation seems to be coinciding with the trendline support and 0.618 retracement level at $78.35 of the price rise from $43.57 in August 2015 to $134.63 in June 2024. Further, the daily RSI is just above 60, indicating that a rebound may be near the corner.
Entry: Above $86
Targets: $94.92, $99.84, and $102.48.
Stop Loss: $78.35-$77.
免責聲明
這些資訊和出版物並不意味著也不構成TradingView提供或認可的金融、投資、交易或其他類型的意見或建議。請在使用條款閱讀更多資訊。
免責聲明
這些資訊和出版物並不意味著也不構成TradingView提供或認可的金融、投資、交易或其他類型的意見或建議。請在使用條款閱讀更多資訊。
