https://www.tradingview.com/x/QGzalipN/
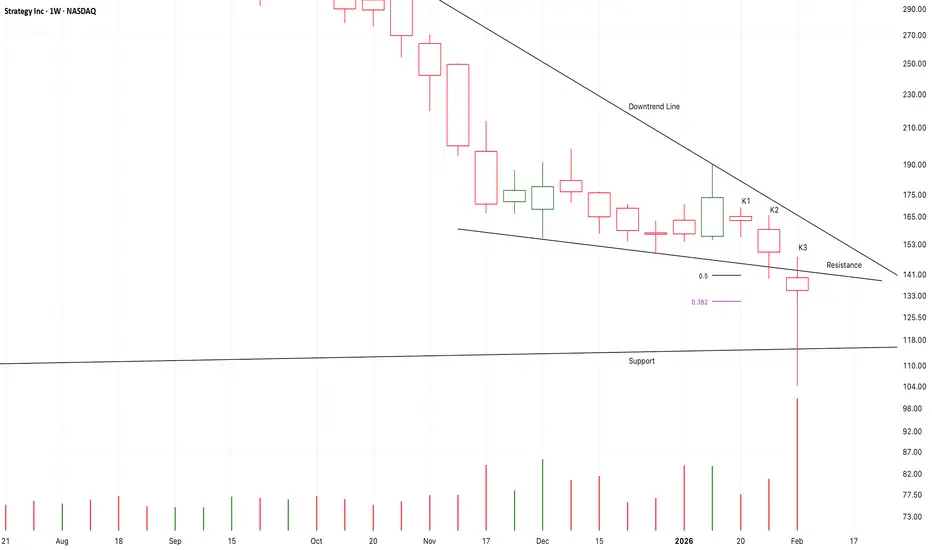
K3 verified a potential support here,
Perhaps it is an earlier signal of a potential bear bottom.
But it must break up the nearest downtrend line here,
And, the support must be verified by more tests.
It takes more time for a bear bottom than a bull top.
If the following candles fall to test the support,
I will try to buy it.
I am expecting the bear market of the bitcoin price target at about 56-50K area.
免責聲明
這些資訊和出版物並非旨在提供,也不構成TradingView提供或認可的任何形式的財務、投資、交易或其他類型的建議或推薦。請閱讀使用條款以了解更多資訊。
免責聲明
這些資訊和出版物並非旨在提供,也不構成TradingView提供或認可的任何形式的財務、投資、交易或其他類型的建議或推薦。請閱讀使用條款以了解更多資訊。