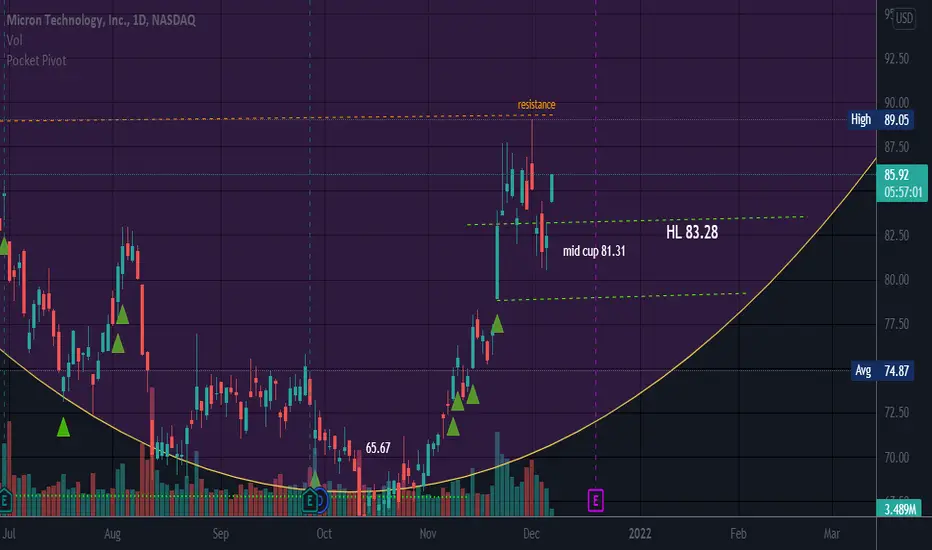
Cup appears to be forming.
I marked mid cup on the chart which is a source of support. In a healthy cup and handle , the handle low should be above mid cup. This handle looks a bit iffy right now and not well formed, but I took a stab at finding it. You may see a better handle that I do (o:
Targets for this pattern are based on the depth of the cup using fib levels. Cup depth is 31.29.
MU looks to have been making a run up and hit a the bottom of a prior gap and turned back down. The top and bottom of a gap can be a form of support if price is above the gap, or resistance if price is below the gap. Sometimes these support and resistance levels become stronger the longer the gap remains in the chart. If price is above a gap and starts filling the gap, it is possible price will go to the bottom of the gap in hopes of finding support. I've noted this is especially true if it is a new stock or price is at newer highs, as there is no recent price action in or before the gap to provide support. For example, a stock such as PG may find support on a pull back within a gap as it is an older security with a lot of chart history and a security like UPST may have more trouble finding support when it was at it's highs as there was no prior price action in the gap.
Long top wicks can point to areas of resistance and long candle tails/shadows can point to support.
Stocks can't go to heaven and there is always going to be a top, eventually where price will turn down.
No recommendation
Short interest is low and negative volume in high
註釋
12/8 Rising wedge developed and breaks bottom trendline at 81.10/not a valid pattern until trendline is broken免責聲明
這些資訊和出版物並不意味著也不構成TradingView提供或認可的金融、投資、交易或其他類型的意見或建議。請在使用條款閱讀更多資訊。