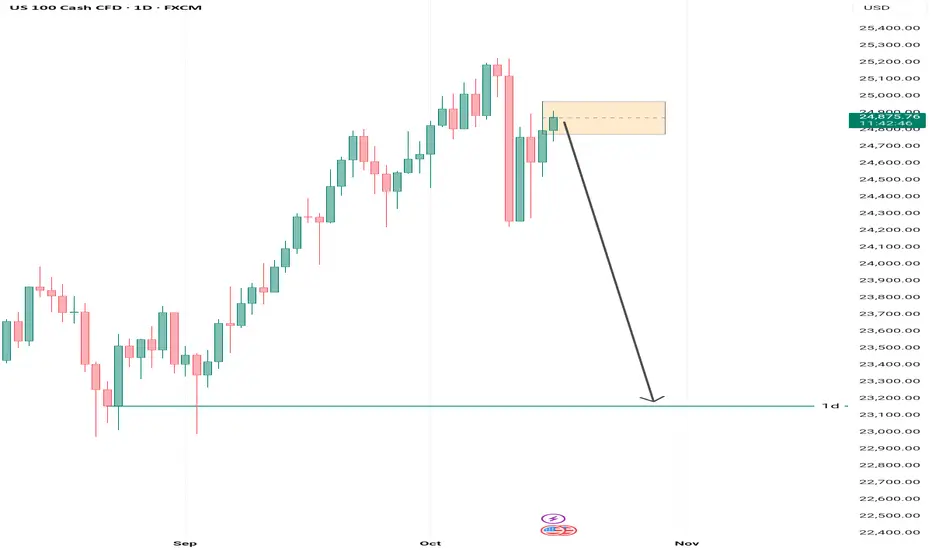
Based on the breakout observed on the 4-hour timeframe and its confirmation on the 30-minute chart — which itself was validated by the M5 structure break within the highlighted golden zone — we expect the price to continue its decline toward the first daily support level.
This setup provides a strong risk-to-reward ratio, as illustrated on the chart.
As always — stay patient, follow your plan, and trust your analysis.
免責聲明
這些資訊和出版物並不意味著也不構成TradingView提供或認可的金融、投資、交易或其他類型的意見或建議。請在使用條款閱讀更多資訊。