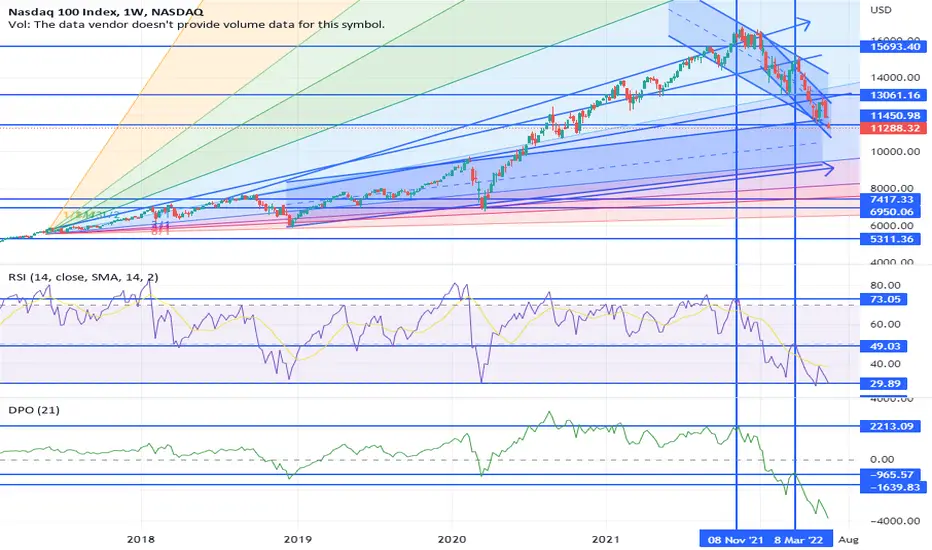
My idea is based on using parallel channels with two oscillators to find historical turning points. Assisting the basic idea with geometrical angles. What I would draw attention to is the unbelievable low reading on the DPO of about -3770. In this time series it has not been that low before (1991-2022). I am basically looking at waiting for a retest of the RSI at 49.03 and the DPO at -965. Actions will depend on what happens then. If it is rejected and then heads back lower this looks like a replay of the 2001-2002 bear market. If RSI finds support at 21.32 this could mark a bottom and be a time to start going long the Nasdaq 100. The rsi could also test 20.84 which was the low of 22/sept/2008. Either way on a successful retest of one of these numbers I think a 1% to 3% position size allocation would be an acceptable risk to take.
免責聲明
這些資訊和出版物並不意味著也不構成TradingView提供或認可的金融、投資、交易或其他類型的意見或建議。請在使用條款閱讀更多資訊。
免責聲明
這些資訊和出版物並不意味著也不構成TradingView提供或認可的金融、投資、交易或其他類型的意見或建議。請在使用條款閱讀更多資訊。