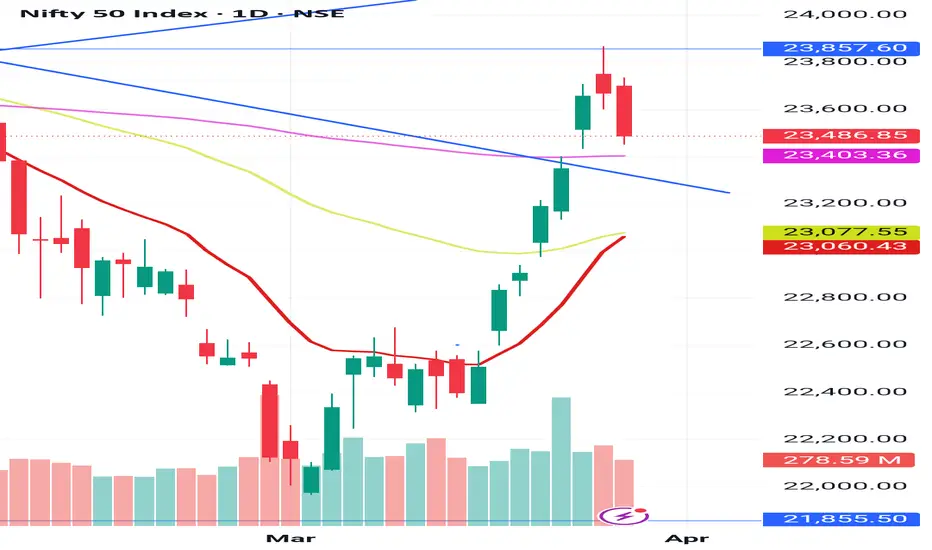
The big bearish candle formed with good volumes in yesterday trading. The candle formation is look like SHOOTING STAR on daily charts after 1500 pts rally from recent lows. If the following candle is red candle it witnessed market enter into a short term bearish trend. The PCR data showing bullish strength in the market.
Support levels : 23400,23303
Resistance levels : 23550,23622
Support levels : 23400,23303
Resistance levels : 23550,23622
免責聲明
這些資訊和出版物並不意味著也不構成TradingView提供或認可的金融、投資、交易或其他類型的意見或建議。請在使用條款閱讀更多資訊。
免責聲明
這些資訊和出版物並不意味著也不構成TradingView提供或認可的金融、投資、交易或其他類型的意見或建議。請在使用條款閱讀更多資訊。