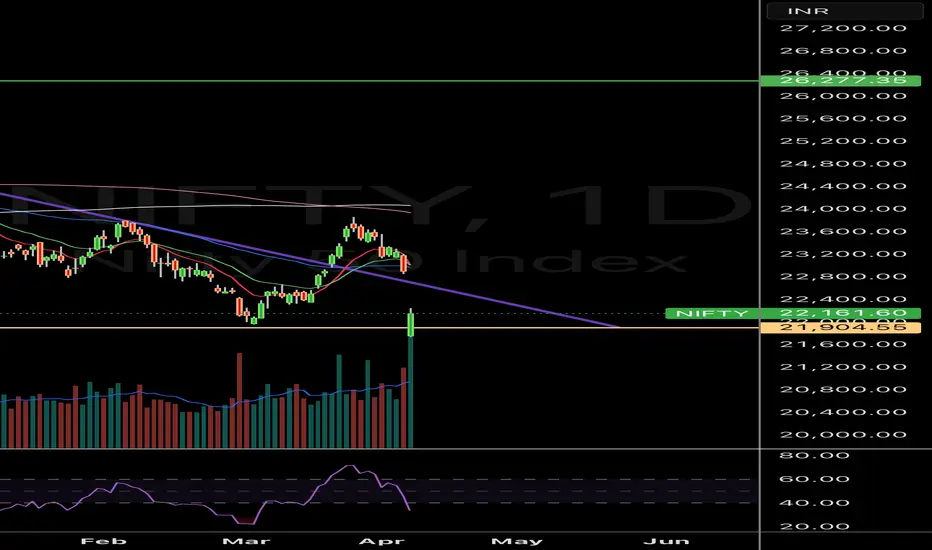
Yes, Nifty closed at 22,161 (-742 pts) after a gap-down, but here’s the bullish lens:
• Price still above 21,900 – a major support & previous breakout zone
• Volume spike could indicate capitulation selling – smart money may be absorbing
• RSI nearing oversold – watch for a bounce
• Bullish structure intact as long as 21,900 holds
If buyers step in here, we may see a V-shape recovery.
This zone is where trendlines break… or bounce.
#Nifty #Nifty50 #TechnicalAnalysis #PriceAction #StockMarket #Bullish #NSE
免責聲明
這些資訊和出版物並不意味著也不構成TradingView提供或認可的金融、投資、交易或其他類型的意見或建議。請在使用條款閱讀更多資訊。
免責聲明
這些資訊和出版物並不意味著也不構成TradingView提供或認可的金融、投資、交易或其他類型的意見或建議。請在使用條款閱讀更多資訊。