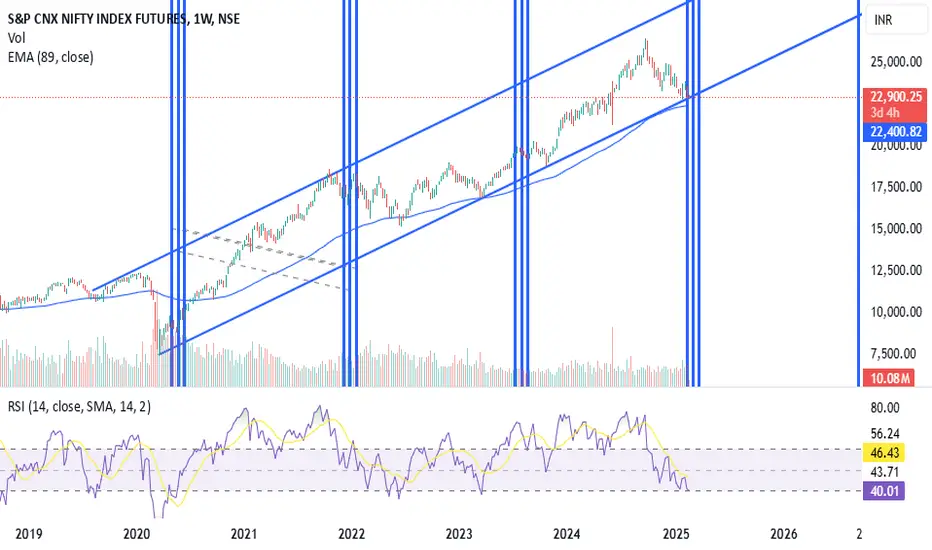
As seen on weekly charts of nifty it has entered a time-cycle zone and multiple supports are in this zone. A trend-line on weekly chart, Weekly moving average, monthly mid of bollinger band or 20 SMA and a bullish time-cycle zone all these supports are in the range of 22200-22800.
A close above a previous day high will show 1st signs of reversal and close above weekly high will confirm the reversal.
Investing partially will be recommended at current levels.
A close above a previous day high will show 1st signs of reversal and close above weekly high will confirm the reversal.
Investing partially will be recommended at current levels.
免責聲明
這些資訊和出版物並不意味著也不構成TradingView提供或認可的金融、投資、交易或其他類型的意見或建議。請在使用條款閱讀更多資訊。
免責聲明
這些資訊和出版物並不意味著也不構成TradingView提供或認可的金融、投資、交易或其他類型的意見或建議。請在使用條款閱讀更多資訊。