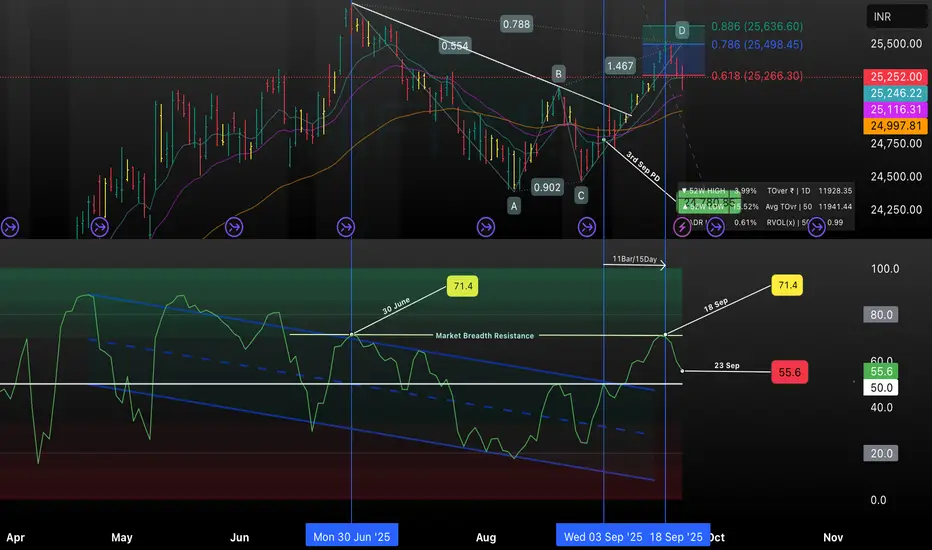
This chart highlights a bearish harmonic setup forming on NIFTY’s daily timeframe, with key confluence at the 0.618 and 0.786 Fibonacci retracement levels. A descending trendline and ABCD points are marked, exposing short-term reversal probability. The RSI indicator shows clear rejection at the 71.4 ‘Market Breadth Resistance’ zone on both June 30 and September 18, 2025, followed by a sharp drop to 55.6 as of September 23. This confluence signals caution for bullish momentum, with support/resistance and volume metrics also annotated for clarity.
免責聲明
這些資訊和出版物並非旨在提供,也不構成TradingView提供或認可的任何形式的財務、投資、交易或其他類型的建議或推薦。請閱讀使用條款以了解更多資訊。
免責聲明
這些資訊和出版物並非旨在提供,也不構成TradingView提供或認可的任何形式的財務、投資、交易或其他類型的建議或推薦。請閱讀使用條款以了解更多資訊。