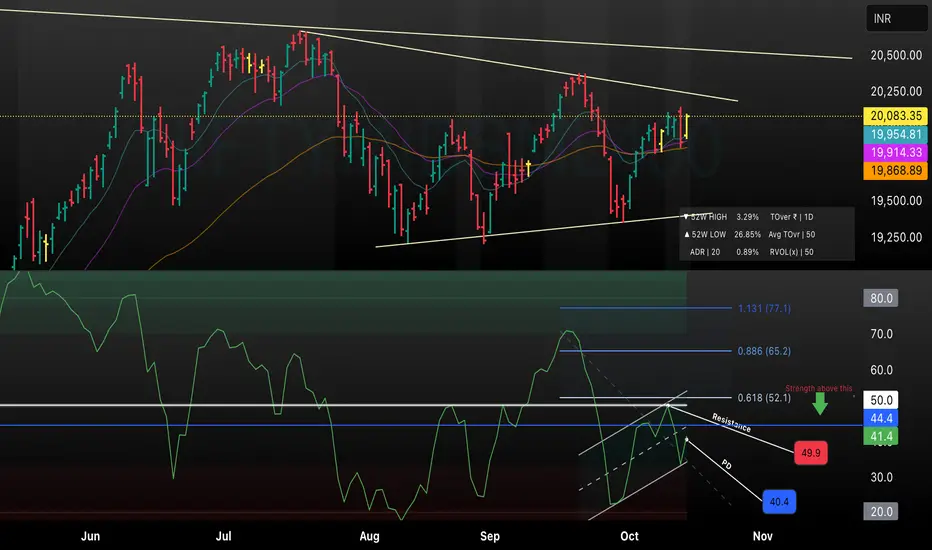
This chart replaces the RSI indicator with a market breadth analysis, offering a broader view of participation across Nifty 50 components. The lower panel now plots a key market breadth indicator such as the Advance-Decline Line or the percentage of stocks trading above key moving averages, highlighting the overall health of the index. An uptick in breadth (broad participation) near resistance lines would strengthen the bullish thesis, while weakening breadth at key levels may warn of impending reversals. This updated setup combines price channel structure, moving averages, and market breadth metrics for more robust, actionable trading decisions.
免責聲明
這些資訊和出版物並非旨在提供,也不構成TradingView提供或認可的任何形式的財務、投資、交易或其他類型的建議或推薦。請閱讀使用條款以了解更多資訊。
免責聲明
這些資訊和出版物並非旨在提供,也不構成TradingView提供或認可的任何形式的財務、投資、交易或其他類型的建議或推薦。請閱讀使用條款以了解更多資訊。