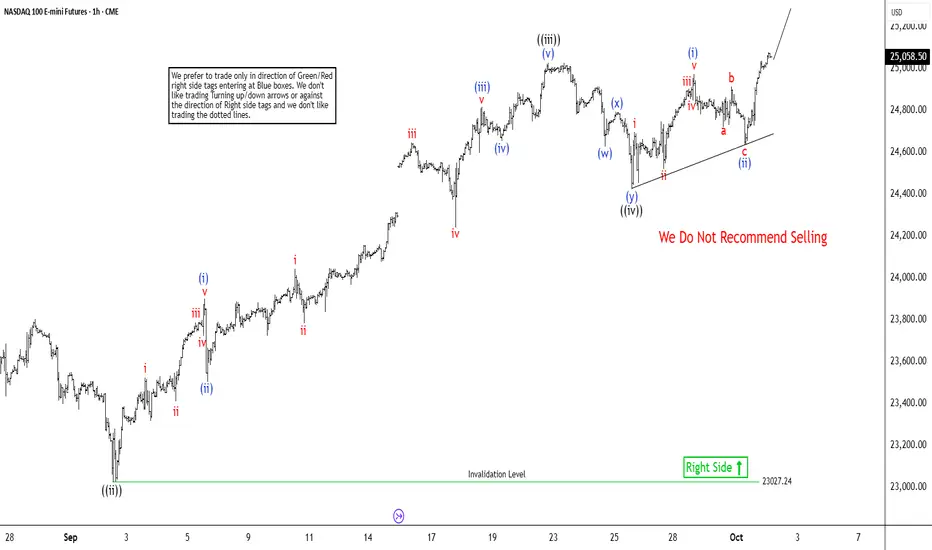
The short-term Elliott Wave analysis for the Nasdaq (NQ) reveals a bullish cycle initiated from the August 2, 2025, low, progressing as a five-wave impulse structure. Wave ((i)) surged to 24,068.5. The corrective wave ((ii)) concluded at 23,025.25, as depicted in the one-hour chart. The Index then advanced in wave ((iii)) to 25,027.25. This wave developed as an impulse in a lesser degree, showcasing robust bullish momentum in the market.
From the wave ((ii)) low, wave (i) climbed to 23,902. A brief dip in wave (ii) stabilized at 23,505. Wave (iii) rallied to 24,816. A minor pullback in wave (iv) ended at 24,655. The final leg, wave (v), reached 25,027.25, completing wave ((iii)) in the higher degree. The subsequent wave ((iv)) correction unfolded as a double-three Elliott Wave structure, a common pattern in such cycles. From wave ((iii)), wave (w) declined to 24,627. Wave (x) recovered to 24,793.50. Wave (y) then dropped to 24,422.5, finalizing wave ((iv)).
As long as the pivotal low at 23,027.2 remains intact, the Index is expected to extend higher in wave ((v)). This outlook supports continued upside in the near term, consistent with the impulsive structure’s progression and market dynamics.
14 days trial --> elliottwave-forecast.com/plan-trial/ and get Accurate & timely Elliott Wave Forecasts of 78 instruments. Webinars, Chat Room, Stocks/Forex/Indices Signals & more.
免責聲明
這些資訊和出版物並不意味著也不構成TradingView提供或認可的金融、投資、交易或其他類型的意見或建議。請在使用條款閱讀更多資訊。
14 days trial --> elliottwave-forecast.com/plan-trial/ and get Accurate & timely Elliott Wave Forecasts of 78 instruments. Webinars, Chat Room, Stocks/Forex/Indices Signals & more.
免責聲明
這些資訊和出版物並不意味著也不構成TradingView提供或認可的金融、投資、交易或其他類型的意見或建議。請在使用條款閱讀更多資訊。