🔍 Chart Setup & Trend
Timeframe: Daily chart
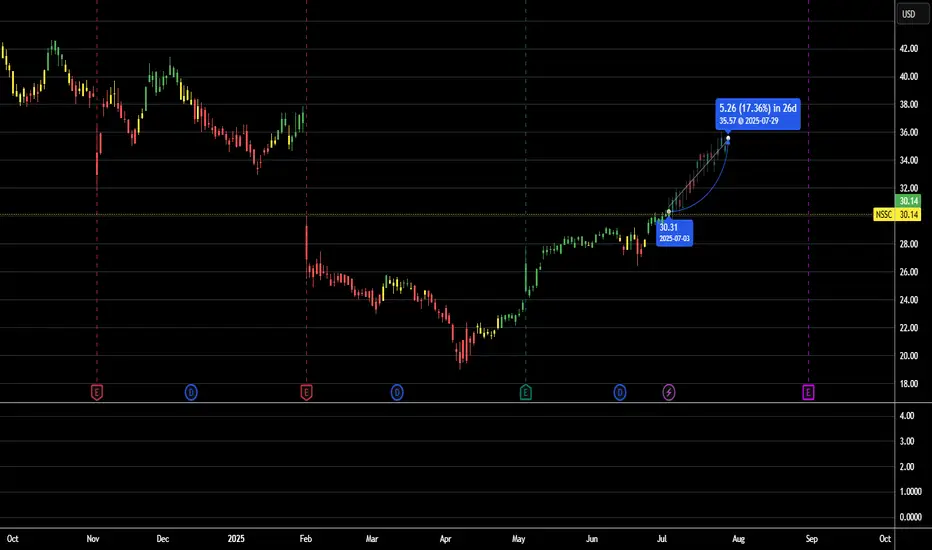
Trend: NSSC has recently rebounded from support around $28 and is attempting a short-term recovery after a corrective phase.
The price is back above the 20-day EMA, signaling renewed buying interest.
A move above $31.00–$31.50 resistance could trigger a bullish breakout.
📊 Key Technical Indicators
RSI: ~54
↳ Neutral zone, with room to move toward overbought territory.
MACD: Bullish crossover is forming
↳ Indicates upside momentum building.
Volume: Increasing volume on green days—suggests accumulation phase.
🔧 Support & Resistance
Support: $28.50 (recent bounce zone)
Resistance 1: $31.00 (near-term ceiling)
Resistance 2: $33.50
17% Price Target: $35.26
🎯 Trade Plan (Short-Term Swing)
Entry: $30.14 (or breakout confirmation above $31.00)
Target (17% gain): $35.26
Stop-loss: $28.40 (below recent swing low and EMA support)
Risk/Reward Ratio: ~1:2.2
📈 Example Calculation
Entry: $30.14
Target: $35.26
Stop-loss: $28.40
Potential Gain: $5.12
Potential Loss: $1.74
⚠️ Risks
If $31.00 fails to break, the stock could range or retest lower support.
Broader tech/security sector weakness could dragNSSC even if setup looks bullish.
Keep an eye on earnings dates or macroeconomic risk (interest rates, spending cuts, etc.).
✅ Summary
Napco Security Technologies (NSSC) shows early signs of a trend reversal. With momentum building above key short-term moving averages, a 17% move to $35.26 is feasible if the stock breaks through $31 with strength.
Entry: ~$30.14
Target: $35.26
Stop-loss: ~$28.40
Outlook: Cautiously Bullish, confirmation above $31 preferred.
Timeframe: Daily chart
Trend:
The price is back above the 20-day EMA, signaling renewed buying interest.
A move above $31.00–$31.50 resistance could trigger a bullish breakout.
📊 Key Technical Indicators
RSI: ~54
↳ Neutral zone, with room to move toward overbought territory.
MACD: Bullish crossover is forming
↳ Indicates upside momentum building.
Volume: Increasing volume on green days—suggests accumulation phase.
🔧 Support & Resistance
Support: $28.50 (recent bounce zone)
Resistance 1: $31.00 (near-term ceiling)
Resistance 2: $33.50
17% Price Target: $35.26
🎯 Trade Plan (Short-Term Swing)
Entry: $30.14 (or breakout confirmation above $31.00)
Target (17% gain): $35.26
Stop-loss: $28.40 (below recent swing low and EMA support)
Risk/Reward Ratio: ~1:2.2
📈 Example Calculation
Entry: $30.14
Target: $35.26
Stop-loss: $28.40
Potential Gain: $5.12
Potential Loss: $1.74
⚠️ Risks
If $31.00 fails to break, the stock could range or retest lower support.
Broader tech/security sector weakness could drag
Keep an eye on earnings dates or macroeconomic risk (interest rates, spending cuts, etc.).
✅ Summary
Napco Security Technologies (
Entry: ~$30.14
Target: $35.26
Stop-loss: ~$28.40
Outlook: Cautiously Bullish, confirmation above $31 preferred.
免責聲明
這些資訊和出版物並不意味著也不構成TradingView提供或認可的金融、投資、交易或其他類型的意見或建議。請在使用條款閱讀更多資訊。
免責聲明
這些資訊和出版物並不意味著也不構成TradingView提供或認可的金融、投資、交易或其他類型的意見或建議。請在使用條款閱讀更多資訊。