Technical Overview
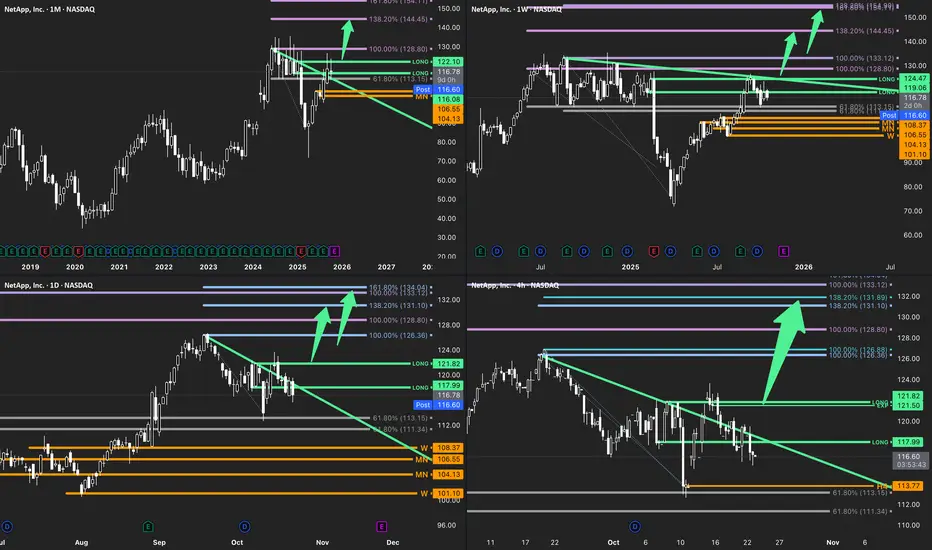
Monthly: Structure confirms a breakout from the corrective base, reclaiming the 61.8% Fib zone and pivot near 116.80. Expansion phase resuming toward upper Fibonacci targets at 128.80 → 138.20%.
Weekly: Price consolidates above the breakout line, holding structure alignment with MN support. The next weekly impulsive move could target the 133–145 resistance cluster.
Daily: Downtrend line broken with follow-through. The D1 wave rhythm now favors continuation as long as 116.60 holds.
H4: Compression wedge resolved upward; local trigger confirmed above 117.99–121.50 zone. Near-term expansion path projects into 128.80 → 133.00 → 138.20%.
Market Phase: Expansion
⸻
Trade Structure & Key Levels
Bias: Long above 116.60
Trigger: H4 higher-low and close above 121.50
Invalidation: H4 close below 113.77
Path: D1 100–138% → W 161.8% zone near 133–145
ATR(14D): 3.9 | Vol(20D): 5.8 M
⸻
Risk & Event Context
Earnings cycle completed; volatility has normalized. Broader tech sector rotation remains supportive, though NASDAQ structure may introduce short-term resistance near index highs.
⸻
Conclusion
NetApp’s structure aligns across all timeframes, confirming a transition from correction to expansion. Sustained closes above 121.50 validate the bullish path toward 133.00–138.00. A close below 113.77 would neutralize the current bias.
⸻
Disclaimer
This analysis is for informational purposes only and does not constitute investment advice, an offer, or a recommendation.
Market conditions and price behavior may change without notice. Past performance is not indicative of future results.
Always conduct your own research or consult a licensed financial advisor before making investment decisions.
Day trader capitalizing on the expansion phases of emerging trends.
MORE CHARTS & FREE EDUCATION
SUBSCRIBE 🚀 themarketflow.trading
MORE CHARTS & FREE EDUCATION
SUBSCRIBE 🚀 themarketflow.trading
免責聲明
這些資訊和出版物並不意味著也不構成TradingView提供或認可的金融、投資、交易或其他類型的意見或建議。請在使用條款閱讀更多資訊。
Day trader capitalizing on the expansion phases of emerging trends.
MORE CHARTS & FREE EDUCATION
SUBSCRIBE 🚀 themarketflow.trading
MORE CHARTS & FREE EDUCATION
SUBSCRIBE 🚀 themarketflow.trading
免責聲明
這些資訊和出版物並不意味著也不構成TradingView提供或認可的金融、投資、交易或其他類型的意見或建議。請在使用條款閱讀更多資訊。
