See Chart
註釋
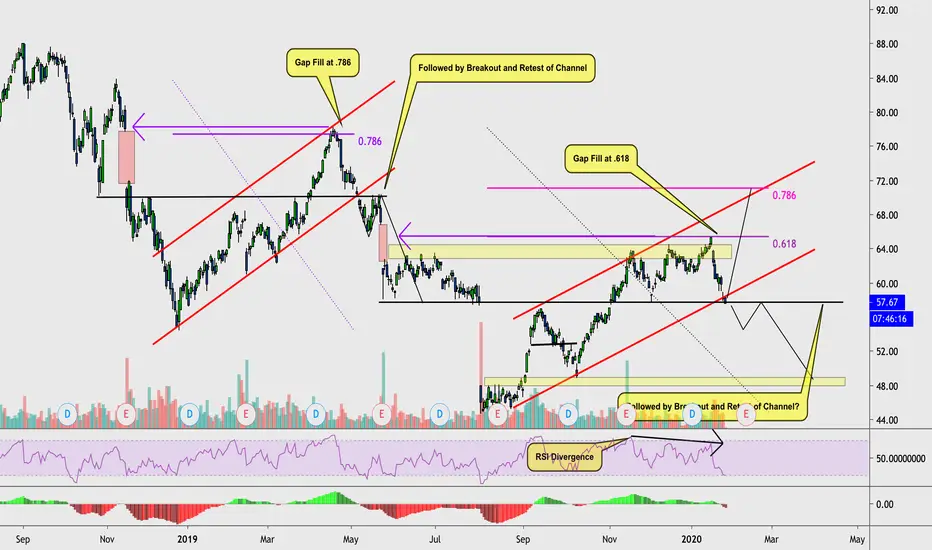
meant to label as a short交易進行
Price made the forecasted bearish breakout and is currently retesting the broken $58 structure as resistance just as it did back between 16-24 of May 2019. This provides us with an interesting pattern that follows historical price action. Will be looking to enter short if structure holds.註釋
Price is moving perfectly according to plan! 免責聲明
這些資訊和出版物並不意味著也不構成TradingView提供或認可的金融、投資、交易或其他類型的意見或建議。請在使用條款閱讀更多資訊。
免責聲明
這些資訊和出版物並不意味著也不構成TradingView提供或認可的金融、投資、交易或其他類型的意見或建議。請在使用條款閱讀更多資訊。