⚡ NTPC Limited (NSE: NTPC) – 1H Chart Analysis
🧠 Market Structure
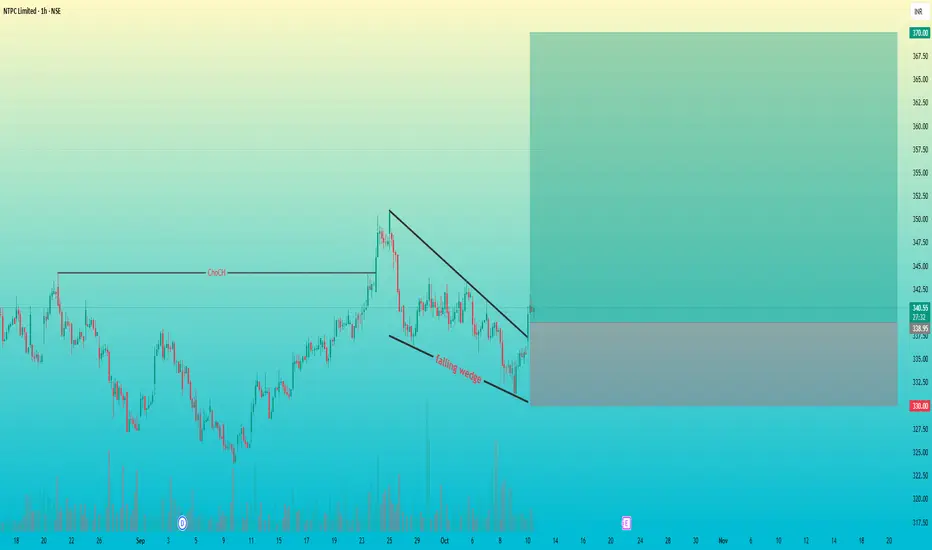
After a strong impulsive move up, the price created a Change of Character (ChoCH) — signaling a shift from bearish to bullish market structure.
Post-ChoCH, price entered a falling wedge corrective pattern — a typical bullish continuation signal.
The wedge breakout indicates a possible resumption of the prior bullish trend.
🔍 Pattern Insight
Pattern: Falling Wedge (Bullish)
Timeframe: 1 Hour
Confirmation: Breakout above wedge resistance
Structure Bias: Bullish continuation
🎯 Trade Plan
Entry: Current Market Price
Stop Loss: ₹330 (below wedge low).
Target: ₹370 (projected from wedge height).
Risk–Reward Ratio: ~1:3
⚙️ Confluences
✅ Falling wedge breakout near ChoCH zone → confirms structural shift
✅ Clear liquidity grab below wedge before breakout (smart money entry)
🧠 Market Structure
After a strong impulsive move up, the price created a Change of Character (ChoCH) — signaling a shift from bearish to bullish market structure.
Post-ChoCH, price entered a falling wedge corrective pattern — a typical bullish continuation signal.
The wedge breakout indicates a possible resumption of the prior bullish trend.
🔍 Pattern Insight
Pattern: Falling Wedge (Bullish)
Timeframe: 1 Hour
Confirmation: Breakout above wedge resistance
Structure Bias: Bullish continuation
🎯 Trade Plan
Entry: Current Market Price
Stop Loss: ₹330 (below wedge low).
Target: ₹370 (projected from wedge height).
Risk–Reward Ratio: ~1:3
⚙️ Confluences
✅ Falling wedge breakout near ChoCH zone → confirms structural shift
✅ Clear liquidity grab below wedge before breakout (smart money entry)
交易進行
免責聲明
這些資訊和出版物並非旨在提供,也不構成TradingView提供或認可的任何形式的財務、投資、交易或其他類型的建議或推薦。請閱讀使用條款以了解更多資訊。