https://www.tradingview.com/x/n2WCvjzC/
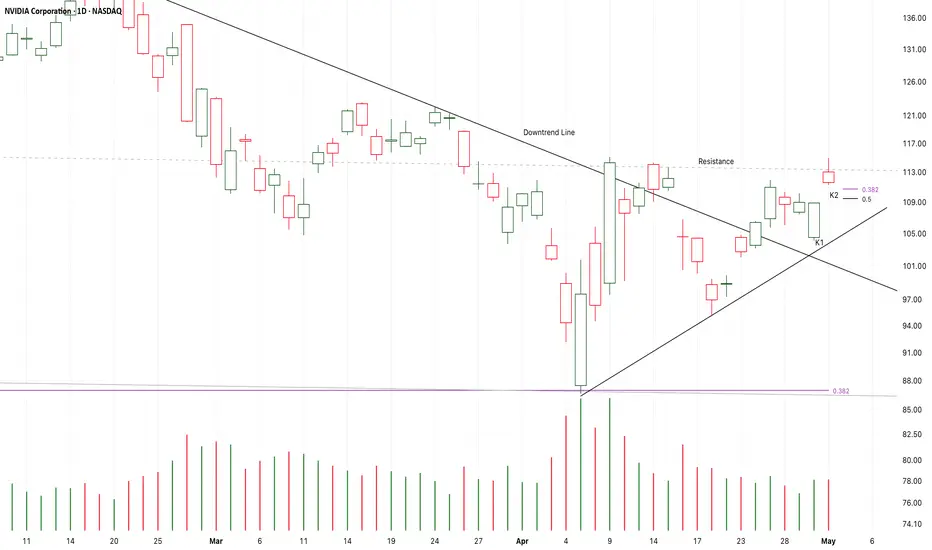
The recent several candles is a consolidation along the resistance.
And the supply pressure keeps at low level.
K1 is a bullish candle and it is also a potential right shoulder of a larger scale bullish head-shoulder pattern.
If the following candles close upon K2,
It is likely that another bull run will start here to test 125USD area.
On the other hand,
If K3 close below the bull gap at K2,
The risk will increase.
Long-110.5/Stop-109/Target-125
註釋
After K1 break up the resistance for a second time,
K2 and K3 tested it under low supply pressure.
If K4 break up K2,
It will be a good place to buy it here.
On the other hand,
If K4 failed to close upon K2 or even break down K3,
The risk will sharply increase.
Long-116.65/Stop-115/Target-125
註釋
K1 and K2 verified a potential strong support,
But, K2 still failed to close upon the resistance.
If K3 is a doji candle under sharply decreasing volume or sharply increasing supply pressure,
The resistance will be still effective.
On the other hand,
If K3 close upon the resistance,
Or, successfully fall to test 0.382-0.5fib area,
It is still valuable to buy it then.
Long-121/Target-195/Stop-113
免責聲明
這些資訊和出版物並不意味著也不構成TradingView提供或認可的金融、投資、交易或其他類型的意見或建議。請在使用條款閱讀更多資訊。
免責聲明
這些資訊和出版物並不意味著也不構成TradingView提供或認可的金融、投資、交易或其他類型的意見或建議。請在使用條款閱讀更多資訊。