📈 Current Price Snapshot
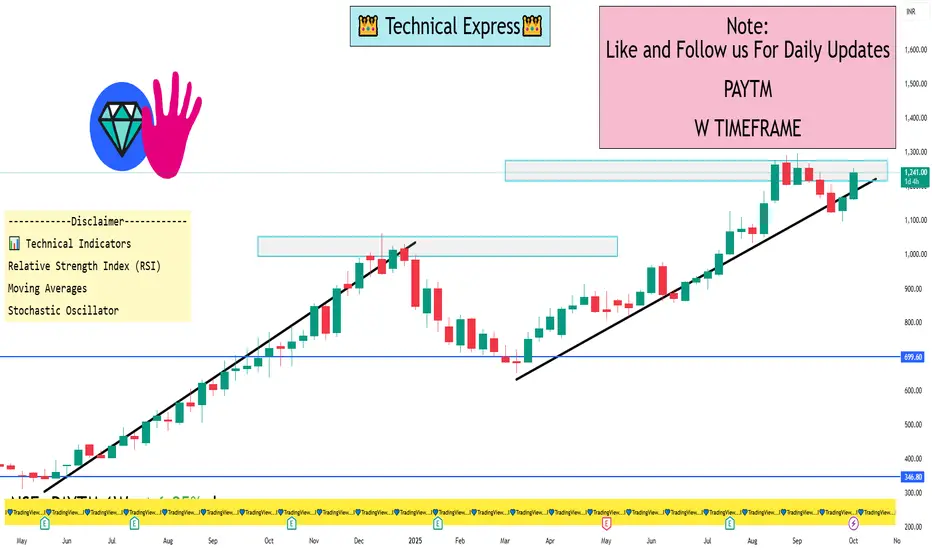
Latest Price: ₹1,241.50
Day's Range: ₹1,224.30 – ₹1,247.80
52-Week Range: ₹651.50 – ₹1,296.60
🔧 Key Technical Levels (1-Week Timeframe)
Resistance Levels:
₹1,247.80 – Recent intraday high
₹1,288.30 – Near-term resistance zone
Support Levels:
₹1,224.30 – Recent intraday low
₹1,119.00 – Short-term support
📊 Technical Indicators
Relative Strength Index (RSI): 57.67 – Indicates bullish momentum without being overbought.
Moving Averages: Both short-term and long-term moving averages are in a bullish alignment, supporting the positive trend.
Stochastic Oscillator: In the bullish zone, suggesting continued upward momentum.
🧭 Summary
The stock is currently trading near its recent intraday high, indicating strong bullish momentum. With RSI and moving averages supporting the uptrend, PAYTM appears poised to test higher resistance levels in the near term. However, investors should monitor the stock's movement near the resistance level of ₹1,288.30 for potential breakout or reversal signals.
WhatsApp: wa.link/adyqmn
Contact - +91 9999764120
| Email: techncialexpress@gmail.com
| Script Coder | Trader | Investor | From India
Contact - +91 9999764120
| Email: techncialexpress@gmail.com
| Script Coder | Trader | Investor | From India
相關出版品
免責聲明
這些資訊和出版物並非旨在提供,也不構成TradingView提供或認可的任何形式的財務、投資、交易或其他類型的建議或推薦。請閱讀使用條款以了解更多資訊。