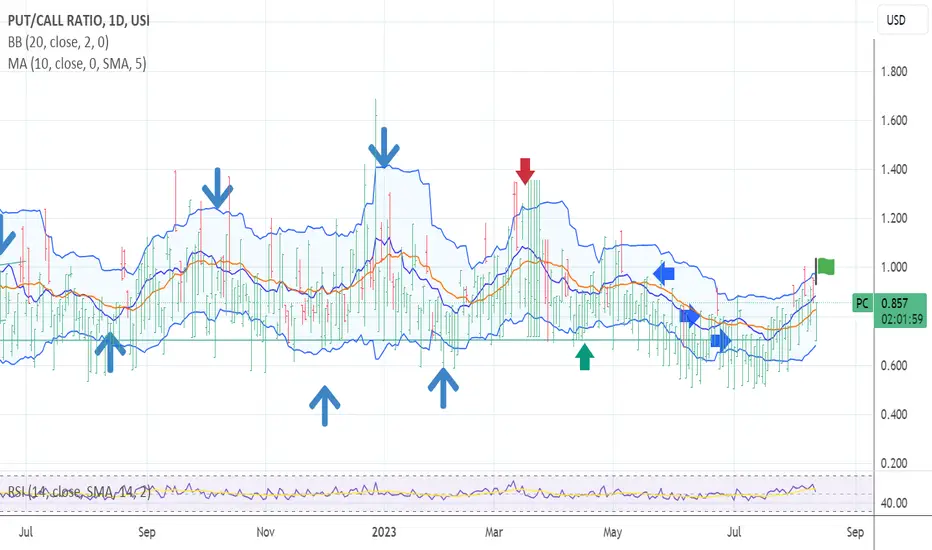
The chart posted is the 5 ,10 and 20 day p/c model The green flag is up this should lead to the final rally of 2023 to peak on or about sept 10 th target is 4666 ideal but from 4631 to 4731 will be there I will exit ALL LONGS THIS IS THE LAST WAVE UP . I then see the break down which should be rather steep and prolonged in a very deep recession as the deflationary cycle is and will be clear based on my work in money velocity . The consumer will be contracting and spending habits will drop very fast due to the paying back of student debt and housing deflation in the rent markets .
免責聲明
這些資訊和出版物並非旨在提供,也不構成TradingView提供或認可的任何形式的財務、投資、交易或其他類型的建議或推薦。請閱讀使用條款以了解更多資訊。