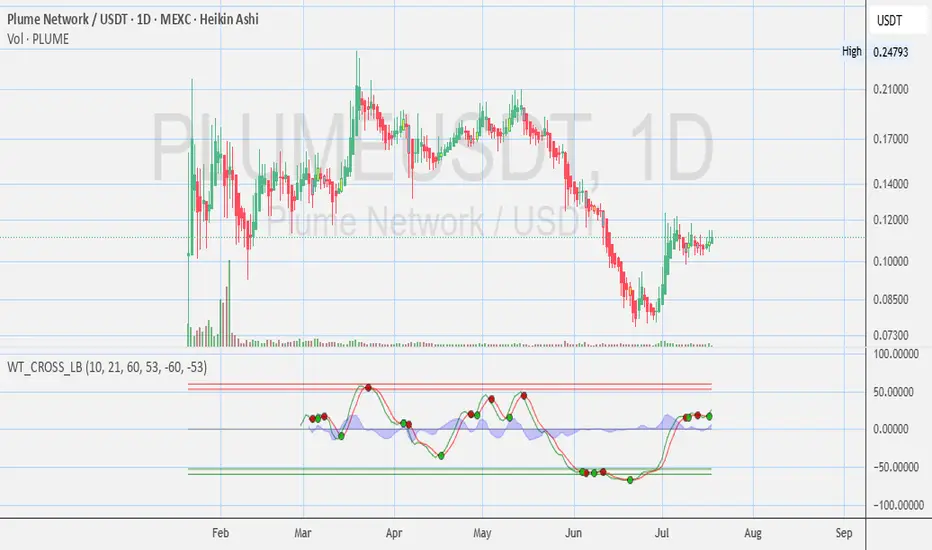
Here's a breakdown and technical analysis of the **PLUME/USDT (1D, Heikin Ashi, MEXC)** chart you provided:
---
📊 **Chart Overview:**
* **Current Price:** Around **\$0.1115**
* **Price Action:** Currently in a short-term **uptrend** after a significant downtrend.
* **Volume:** Noticeable **increase in volume** during the recent reversal in early July, indicating strong buying interest.
---
🔍 **Heikin Ashi Candles:**
* Heikin Ashi smooths out price action.
* **Recent candles are green** and fairly consistent in body size, suggesting **bullish momentum**.
* Prior to this, there was a long series of **red candles** from late May to late June indicating strong bearish sentiment, which now appears to be reversing.
---
📈 **Support and Resistance:**
* **Support Zone:** Around **\$0.085 - \$0.090** (confirmed by the recent bounce).
* **Current Resistance:** Near **\$0.120 - \$0.125** (the price is consolidating just below this).
* **Major Resistance above:** \~**\$0.14 - \$0.15**, then \~\$0.17
---
📉 **WT\_CROSS\_LB Indicator (WaveTrend Oscillator):**
* **WaveTrend lines are crossing above 0**, and staying strong, indicating a continuation of **bullish momentum**.
* The last red and green dots suggest a bullish cross occurred recently and is still valid.
* The oscillator is not yet in the overbought zone (above 60), which means there’s still **room for upward movement**.
---
🔎 **Trend Analysis:**
* **Trend Reversal:** Confirmed with rising price and increasing volume.
* **Higher Lows Forming:** This is a bullish sign, suggesting accumulation phase or early trend reversal.
✅ Bullish Signals:
* Strong bounce from \~\$0.085
* Bullish Heikin Ashi candles and WaveTrend crossover
* Good volume support on the reversal
⚠️ Caution:
* Facing resistance near \$0.120 — need to break and hold above to confirm next leg up.
* Potential for short-term pullback before further upside
--
Disclosures:
This analysis is for informational purposes only and is not financial advice. It does not constitute a recommendation to buy, sell, or trade any securities, cryptocurrencies, or stocks. Trading involves significant risk, and you should consult with a qualified financial advisor before making any investment decisions. Past performance is not indicative of future results.
---
📊 **Chart Overview:**
* **Current Price:** Around **\$0.1115**
* **Price Action:** Currently in a short-term **uptrend** after a significant downtrend.
* **Volume:** Noticeable **increase in volume** during the recent reversal in early July, indicating strong buying interest.
---
🔍 **Heikin Ashi Candles:**
* Heikin Ashi smooths out price action.
* **Recent candles are green** and fairly consistent in body size, suggesting **bullish momentum**.
* Prior to this, there was a long series of **red candles** from late May to late June indicating strong bearish sentiment, which now appears to be reversing.
---
📈 **Support and Resistance:**
* **Support Zone:** Around **\$0.085 - \$0.090** (confirmed by the recent bounce).
* **Current Resistance:** Near **\$0.120 - \$0.125** (the price is consolidating just below this).
* **Major Resistance above:** \~**\$0.14 - \$0.15**, then \~\$0.17
---
📉 **WT\_CROSS\_LB Indicator (WaveTrend Oscillator):**
* **WaveTrend lines are crossing above 0**, and staying strong, indicating a continuation of **bullish momentum**.
* The last red and green dots suggest a bullish cross occurred recently and is still valid.
* The oscillator is not yet in the overbought zone (above 60), which means there’s still **room for upward movement**.
---
🔎 **Trend Analysis:**
* **Trend Reversal:** Confirmed with rising price and increasing volume.
* **Higher Lows Forming:** This is a bullish sign, suggesting accumulation phase or early trend reversal.
✅ Bullish Signals:
* Strong bounce from \~\$0.085
* Bullish Heikin Ashi candles and WaveTrend crossover
* Good volume support on the reversal
⚠️ Caution:
* Facing resistance near \$0.120 — need to break and hold above to confirm next leg up.
* Potential for short-term pullback before further upside
--
Disclosures:
This analysis is for informational purposes only and is not financial advice. It does not constitute a recommendation to buy, sell, or trade any securities, cryptocurrencies, or stocks. Trading involves significant risk, and you should consult with a qualified financial advisor before making any investment decisions. Past performance is not indicative of future results.
免責聲明
這些資訊和出版物並不意味著也不構成TradingView提供或認可的金融、投資、交易或其他類型的意見或建議。請在使用條款閱讀更多資訊。
免責聲明
這些資訊和出版物並不意味著也不構成TradingView提供或認可的金融、投資、交易或其他類型的意見或建議。請在使用條款閱讀更多資訊。
