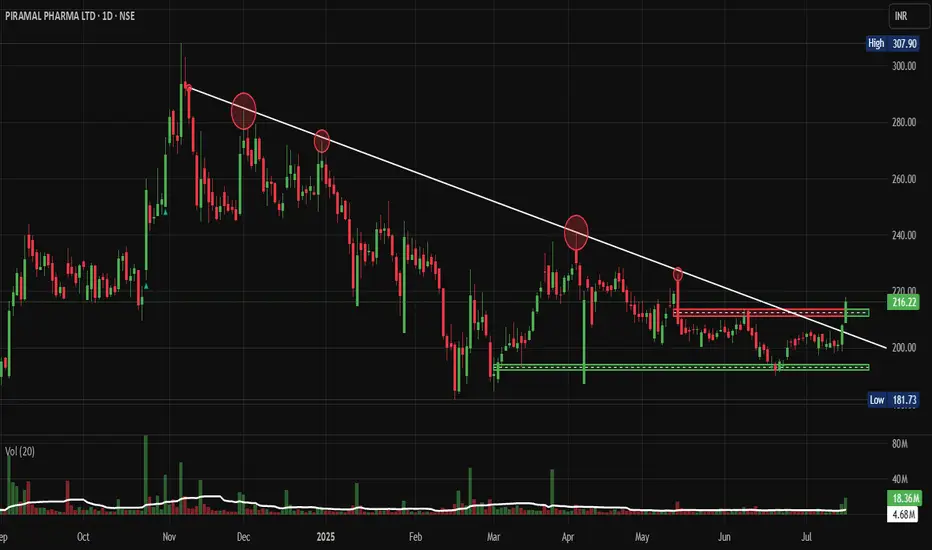
Price Action:
- Current Price: ₹216.22 (as of July 15, 2025)
- 52-week Range: ₹181.73 - ₹307.90
- The stock has been in a clear descending triangle pattern since November 2024
- Price has been consistently making lower highs while finding support around the ₹190-200 zone
- Recent price action shows signs of consolidation near the apex of the triangle
Volume Spread Analysis:
- Average daily volume: 4.68M shares
- Volume spikes were observed during significant price movements in November 2024 and March 2025
- Recent volume has been relatively subdued, indicating a lack of conviction in either direction
- Volume pattern suggests an accumulation phase with periodic distribution
Key Technical Levels:
Support Levels:
- Primary Support: ₹190-200 (multiple tests, strong base)
- Secondary Support: ₹181.73 (52-week low)
- Psychological Support: ₹175-180 zone
Resistance Levels:
- Immediate Resistance: ₹230-240 (descending trendline)
- Secondary Resistance: ₹250-260 (previous swing high)
- Major Resistance: ₹280-290 (November 2024 high)
Base Formation:
- The stock has formed a solid base between ₹190-220 over the past 4 months
- This base represents a potential accumulation zone for institutional investors
- The horizontal support at ₹200 has been tested multiple times, showing its significance
Technical Patterns:
- Primary Pattern: Descending Triangle
- Secondary Pattern: Potential Cup and Handle formation if the stock breaks above ₹240
- The descending triangle spans approximately 8 months, making it a significant pattern
Trade Setup:
Entry Strategy:
- Breakout Entry: Buy above ₹240 with volume confirmation
- Support Entry: Buy near ₹200-205 for swing trade
- Conservative Entry: Wait for weekly close above ₹245 for momentum play
Exit Levels:
- Short-term Target: ₹260-270
- Medium-term Target: ₹290-300
- Long-term Target: ₹350-380
Stop-Loss Levels:
- For breakout trades: ₹225 (below breakdown level)
- For support trades: ₹185 (below 52-week low)
- Trailing stop: 8-10% below entry price
Position Sizing:
- Risk per trade: Maximum 2% of portfolio
- For ₹240 entry with ₹225 stop: Position size = (Portfolio × 0.02) / 15
- Suggested allocation: 1-2% of total portfolio for this trade
Risk Management:
- Maximum holding period: 3-6 months
- Review position if stock fails to break ₹240 within 4 weeks
- Partial profit booking at ₹270 (book 50% position)
- Trail stop-loss after first target achievement
Sectoral and Fundamental Backdrop:
Sectoral Analysis:
- The India Pharmaceutical Market size is estimated at USD 66.66 billion in 2025, and is expected to reach USD 88.86 billion by 2030, at a CAGR of 5.92% during the forecast period (2025-2030)
- India's pharmaceutical industry ranks third globally in pharmaceutical production by volume and 14th by value, supported by a well-established domestic sector comprising approximately 3,000 drug companies and over 10,000 custom manufacturing units
- The Indian pharmaceuticals industry is expected to grow 9-11% in the financial year 2024, as per ICRA
- The biosimilars market in India is expected to grow at a CAGR of 22%, reaching USD 12 billion by 2025, representing nearly 20% of the country's pharmaceutical market
Company Fundamentals:
- Market Cap: 28,745 Crore (up 42.2% in 1 year), Revenue: 9,151 Cr, Profit: 91.1 Cr
- Stock is trading at 3.53 times its book value
- The company has a low interest coverage ratio, Promoter Holding: 34.94%
- The P/E ratio of Piramal Pharma Ltd is 324 times as on 15-July-2025, a 651% premium to its peers' median range of 33.45 times
Business Overview:
- The company has a 49% ownership interest in a joint venture with Allergan India Pvt. Ltd (Avvyie, a US pharmaceutical company, holds a 51% ownership interest), which is one of the leading pharmaceutical companies in Ophthalmology formulations in India
- Strong presence in glaucoma and dry eye treatments
- Diversified portfolio across multiple therapeutic areas
Analyst Targets:
- Recent research reports show an average share price target of 253
- The estimated share price target for 2025 can range from ₹198 to ₹350
Investment Thesis:
Bullish Factors:
- Strong sectoral tailwinds with the Indian pharma market growing at 5.92% CAGR
- Solid base formation indicating institutional accumulation
- Reasonable valuation compared to growth prospects
- Strategic partnership with Allergan provides a competitive advantage
Risk Factors:
- A high P/E ratio indicates expensive valuation
- A low interest coverage ratio suggests financial stress
- Regulatory changes in the pharmaceutical sector
My Take:
Keep in the Watchlist.
NO RECO. For Buy/Sell.
📌Thank you for exploring my idea! I hope you found it valuable.
🙏FOLLOW for more
👍BOOST if you found it useful.
✍️COMMENT below with your views.
Meanwhile, check out my other stock ideas on the right side until this trade is activated. I would love your feedback.
Disclaimer: "I am not a SEBI REGISTERED RESEARCH ANALYST AND INVESTMENT ADVISER."
This analysis is intended solely for informational and educational purposes and should not be interpreted as financial advice. It is advisable to consult a qualified financial advisor or conduct thorough research before making investment decisions.
相關出版品
免責聲明
這些資訊和出版物並非旨在提供,也不構成TradingView提供或認可的任何形式的財務、投資、交易或其他類型的建議或推薦。請閱讀使用條款以了解更多資訊。
