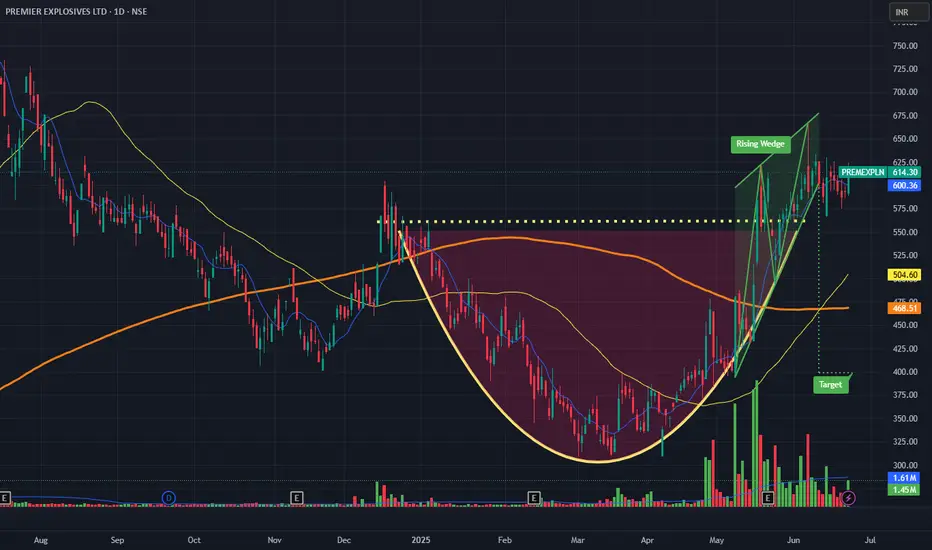
The stock exhibits a classic cup and handle pattern spanning several months.
Cup formation: The initial decline from highs around 680 to lows near 320, followed by a gradual recovery
Handle formation: The consolidation phase around 400-500 levels before the recent breakout
Breakout: Strong upward movement with increased volume, currently trading around 614.30
Key Technical Observations
Support and Resistance Levels:
Major support established around 320-340 (cup bottom)
Resistance broken at approximately 500-520 level
Current resistance likely around 680 (previous highs)
Moving Average Analysis:
Price has broken above both moving averages (yellow and blue lines)
The moving averages are beginning to slope upward, indicating trend change
Volume Confirmation:
Significant volume spikes during the recent breakout phase (visible in green volume bars)
Volume expansion confirms the legitimacy of the price movement.
think we will soon see a breakout above 700
-warena
免責聲明
The information and publications are not meant to be, and do not constitute, financial, investment, trading, or other types of advice or recommendations supplied or endorsed by TradingView. Read more in the Terms of Use.
-warena
免責聲明
The information and publications are not meant to be, and do not constitute, financial, investment, trading, or other types of advice or recommendations supplied or endorsed by TradingView. Read more in the Terms of Use.
