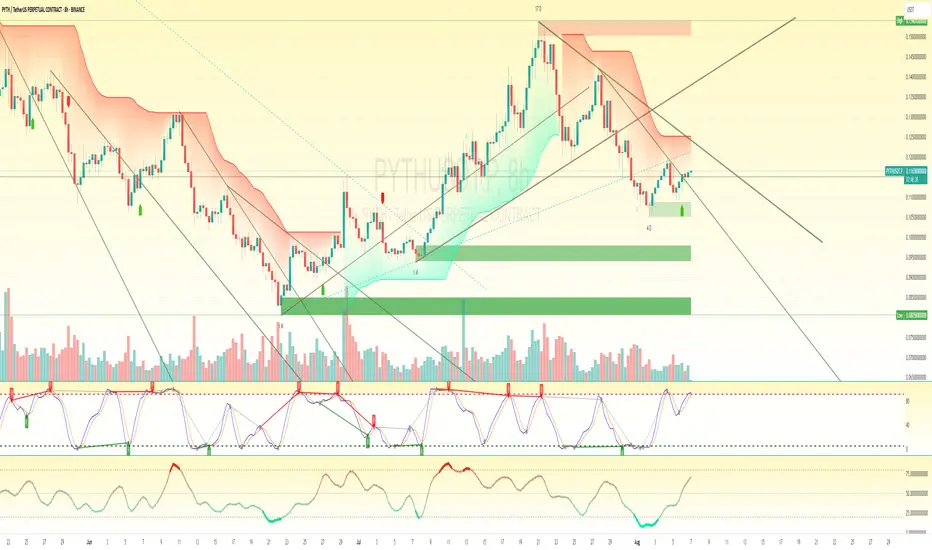
🔍 Chart Context Analysis
Trend: Clearly bearish structure with persistent lower highs and lower lows.
Price Location: Trading below the EMA cloud and under both descending trendlines — shows bearish control.
Stochastic RSI (8H): In overbought region and beginning to roll over — early signal of bearish momentum building.
MACD/Stochastic Momentum Below: Shows recent bullish recovery but now stalling near the midline, potentially turning.
Volume: Volume is weak and not supporting a strong bullish reversal.
Liquidity Pools Below: Thick demand zones between $0.105 – $0.100 and $0.085 – $0.080 visible.
🟠 Most Probable Setup: Bearish Rejection from EMA Cloud
This is a short trade setup rejecting from the EMA resistance zone and trendline.
🔹 Sniper Entry:
Entry Zone: $0.1160 – $0.1170 (current price range)
Ideally enter near $0.1170 if price sweeps it on a wick and rejects
Stop loss should sit above the recent swing high and trendline confluence
🔹 Stop Loss (SL):
$0.1205
Just above EMA cloud and previous bearish breaker
Invalidates the setup if price sustains above this level
🔹 Take Profit Targets:
TP1 Range: $0.1105 – $0.1080 → (first support + minor liquidity zone)
TP2: $0.1050 → (major demand/4D support low)
TP3 (optional): $0.1000 → (if momentum continues and stochastic breaks down hard)
⏱️ Estimated Timeframe for TP Hits:
TP1: 6–12 hours
TP2: 18–24 hours
TP3: 1.5–2.5 days (if broader bearish move unfolds)
✅ Key Reasons for Bearish Bias
EMA cloud acting as dynamic resistance.
Stochastic RSI overbought and potentially crossing down.
Price under HTF trendlines and structure.
No strong bullish volume spike — indicating weak bull follow-through.
Multiple liquidity pools still uncollected below ($0.105 – $0.100).
🚫 When to Invalidate the Short:
Price closes above $0.1205 on 8H candle.
Bullish volume spike with engulfing candle.
Bullish breakout through both descending trendlines.
交易結束:達到停損點
Stopped out. 免責聲明
這些資訊和出版物並不意味著也不構成TradingView提供或認可的金融、投資、交易或其他類型的意見或建議。請在使用條款閱讀更多資訊。
免責聲明
這些資訊和出版物並不意味著也不構成TradingView提供或認可的金融、投資、交易或其他類型的意見或建議。請在使用條款閱讀更多資訊。
