RACL Geartech Ltd – Trendline Breakout with Volume Confirmation! 🚀🔥
📅 Date: April 12, 2025
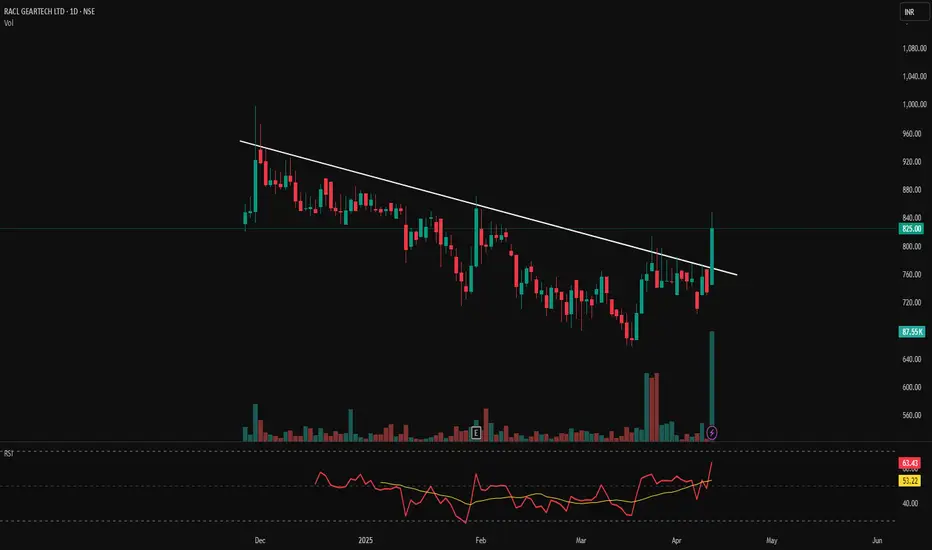
📊 Chart Overview:
RACL Geartech has shown a strong bullish breakout above a long-standing descending trendline resistance, backed by a massive volume surge—a classic breakout confirmation signal.
📌 Key Levels:
📈 Breakout Level (Previous Resistance): ₹760
✅ New Support: ₹760
🔼 Resistance Zones Ahead: ₹860 ➡️ ₹900 ➡️ ₹950
⚠️ Stop-loss for Swing Position: ₹740 (below breakout + trendline)
📈 Technical Indicators:
📊 Volume Spike: Today’s volume (87.5K) is significantly higher than the recent average, indicating strong buying interest.
📉 RSI (Relative Strength Index): At 63.43, showing positive momentum with potential room before entering overbought territory.
📉 MACD-like indicator (yellow line vs red line crossover): Clear upward crossover—bullish shift in momentum.
📏 Trendline drawn from December 2024 highs to recent lower highs—now convincingly broken.
🧠 Trade Strategy:
🎯 Consider buying on dips near ₹770–₹785 if retest occurs.
🛡 SL: ₹740
🎯 Targets: ₹860 ➡️ ₹900 ➡️ ₹950
📌 Disclaimer: This chart is for educational and analytical purposes. Always conduct your own analysis or consult a registered financial advisor before taking any trading/investment decision.
📅 Date: April 12, 2025
📊 Chart Overview:
RACL Geartech has shown a strong bullish breakout above a long-standing descending trendline resistance, backed by a massive volume surge—a classic breakout confirmation signal.
📌 Key Levels:
📈 Breakout Level (Previous Resistance): ₹760
✅ New Support: ₹760
🔼 Resistance Zones Ahead: ₹860 ➡️ ₹900 ➡️ ₹950
⚠️ Stop-loss for Swing Position: ₹740 (below breakout + trendline)
📈 Technical Indicators:
📊 Volume Spike: Today’s volume (87.5K) is significantly higher than the recent average, indicating strong buying interest.
📉 RSI (Relative Strength Index): At 63.43, showing positive momentum with potential room before entering overbought territory.
📉 MACD-like indicator (yellow line vs red line crossover): Clear upward crossover—bullish shift in momentum.
📏 Trendline drawn from December 2024 highs to recent lower highs—now convincingly broken.
🧠 Trade Strategy:
🎯 Consider buying on dips near ₹770–₹785 if retest occurs.
🛡 SL: ₹740
🎯 Targets: ₹860 ➡️ ₹900 ➡️ ₹950
📌 Disclaimer: This chart is for educational and analytical purposes. Always conduct your own analysis or consult a registered financial advisor before taking any trading/investment decision.
免責聲明
這些資訊和出版物並不意味著也不構成TradingView提供或認可的金融、投資、交易或其他類型的意見或建議。請在使用條款閱讀更多資訊。
免責聲明
這些資訊和出版物並不意味著也不構成TradingView提供或認可的金融、投資、交易或其他類型的意見或建議。請在使用條款閱讀更多資訊。