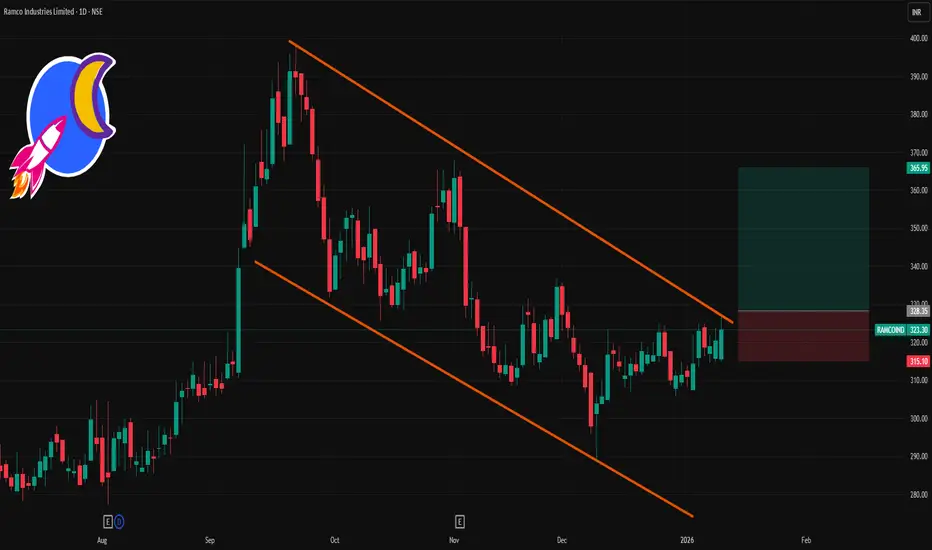
📈 Current Price (Approx Latest Close)
📌 Last Traded / Closing Price: ~₹323.30 on NSE (as of Jan 9, 2026)
📊 Daily Pivot & Support/Resistance Levels
Classic Pivot Levels (Daily)
These are useful for intraday and short‑term directional bias:
Level Price (Approx)
R3 ~₹336.23
R2 ~₹329.12
R1 ~₹321.78
Pivot ~₹314.67
S1 ~₹307.33
S2 ~₹300.22
S3 ~₹292.88
Interpretation:
Above Pivot (~314–315): bullish bias.
Above R1 (~321–322): stronger upside view.
Break above R2 (~329): could shift momentum higher intraday.
Below Pivot: more bears in control.
📌 Alternate Daily Pivot (Standard)
Another reliable pivot view from recent technical data:
Level Price
R3 ~₹324.02
R2 ~₹321.03
R1 ~₹316.62
Pivot ~₹313.63
S1 ~₹309.22
S2 ~₹306.23
S3 ~₹301.82
This set is slightly tighter but confirms similar zones near ₹310–₹322.
📌 How to Use These Levels Today
Bullish below/above strategy:
Bullish view: Price staying above Pivot (~₹314–315) and ideally R1 (~₹321–322) — targets R2 (~₹329) then R3 (~₹336).
Bearish risk: If price fails below Pivot (~₹314), next stops are S1 (~₹307) → S2 (~₹300).
🧾 Summary — 1D Levels Snapshot
Zone Level
Resistance 3 ~₹336
Resistance 2 ~₹329
Resistance 1 ~₹322
Pivot ~₹315
Support 1 ~₹307
Support 2 ~₹300
Support 3 ~₹293
相關出版品
免責聲明
這些資訊和出版物並非旨在提供,也不構成TradingView提供或認可的任何形式的財務、投資、交易或其他類型的建議或推薦。請閱讀使用條款以了解更多資訊。