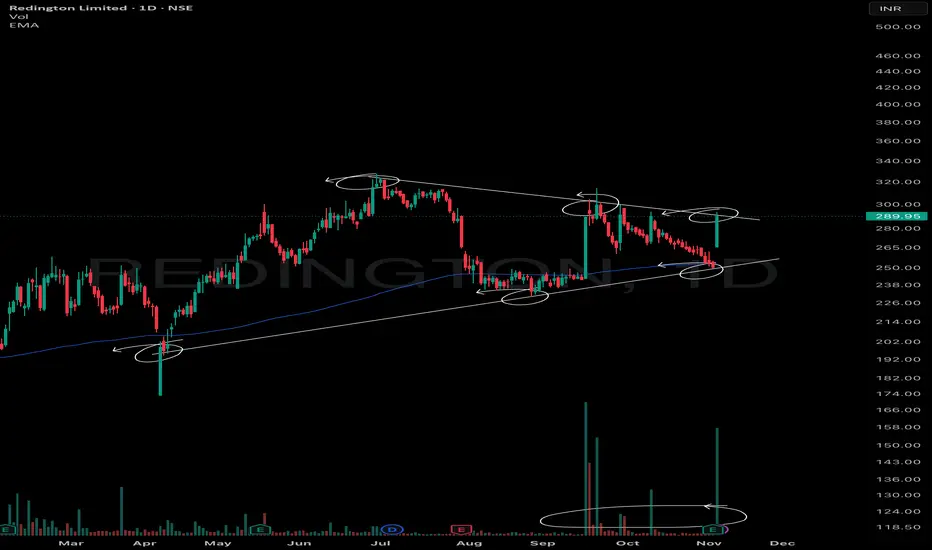
This chart displays a Volatility Contraction Pattern (VCP) developing within a classic symmetrical triangle on the daily timeframe. Two sharply converging trendlines encapsulate the price action with the lower line connecting a series of higher lows (the trendline) and the upper line linking lower highs (counter trendline). Such convergence is characteristic of symmetrical triangles, which represent a period of price consolidation and equilibrium between buyers and sellers.
Volume tends to contract as the pattern matures, signaling market indecision and reduced volatility. Notably, this consolidation is taking place right around the 200-day moving average, which serves as an important reference point for longer-term market participants. The convergence of price and volume patterns here aligns with textbook VCP behaviour and highlights the potential for significant crowd psychology shifts.
This post’s intent is observational and educational, focusing on the visual behavior of price and volume embedded within technical patterns. Studying such symmetries can strengthen understanding of market structure and technical analysis skills, allowing for systematic review rather than speculative outlooks or trade signals.
🎯 Master My Self-Made Trading Strategy
📈 Telegram (Learn Today): t.me/hashtaghammer
✅ WhatsApp (Learn Today): wa.me/919455664601
📈 Telegram (Learn Today): t.me/hashtaghammer
✅ WhatsApp (Learn Today): wa.me/919455664601
相關出版品
免責聲明
這些資訊和出版物並非旨在提供,也不構成TradingView提供或認可的任何形式的財務、投資、交易或其他類型的建議或推薦。請閱讀使用條款以了解更多資訊。