📈 Technical Analysis:
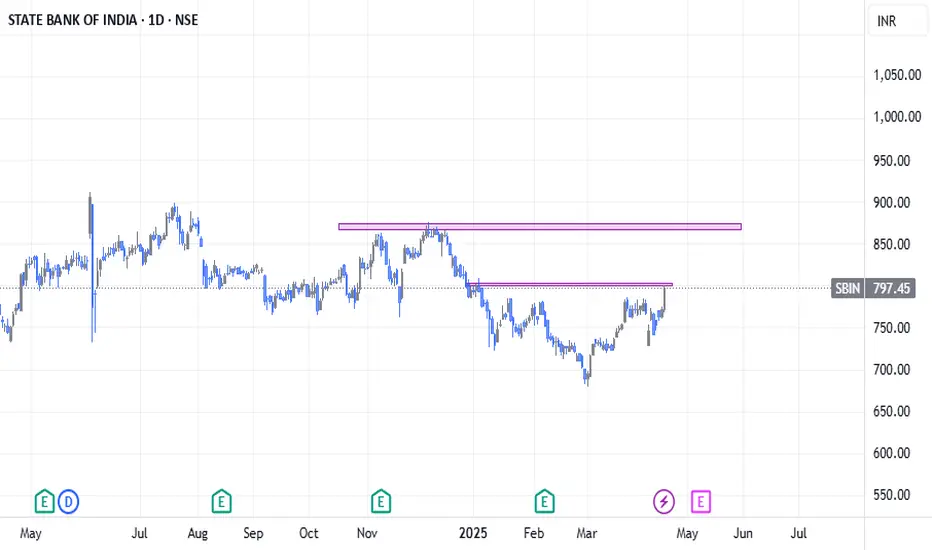
Strong breakout seen on the daily chart after price moved above a key neckline zone, signaling potential trend reversal.
Price has also closed above the 200-day moving average (200 MA) on the daily timeframe – a strong bullish indicator.
On the weekly chart, there's noticeable buying momentum, with a breakout above the 50-week moving average (50 MA), confirming strength on a higher timeframe.
📊 Overall View:
Multiple bullish confirmations across daily and weekly charts suggest further upside potential.
A successful of the breakout zone could lead to strong upward continuation.
✅ Bias: Bullish
🔎 Watch Levels:
Support: Breakout zone / 200 MA
Resistance: Previous swing highs
🚫 Disclaimer: This is not financial advice. Please do your own research and consult your financial advisor before making any investment decisions.
交易結束:目標達成
免責聲明
這些資訊和出版物並不意味著也不構成TradingView提供或認可的金融、投資、交易或其他類型的意見或建議。請在使用條款閱讀更多資訊。
免責聲明
這些資訊和出版物並不意味著也不構成TradingView提供或認可的金融、投資、交易或其他類型的意見或建議。請在使用條款閱讀更多資訊。