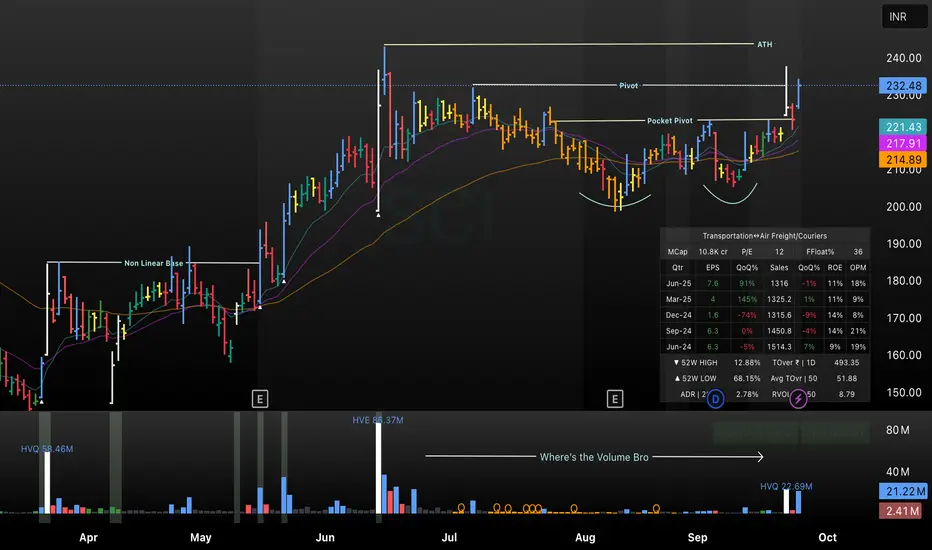
This TradingView chart of SCI highlights a non-linear base formation followed by a powerful pocket pivot and a breakout to all-time highs (ATH) in September 2025. The annotated chart showcases key technical structures: a pivot, pocket pivot level, and the ATH breakout, along with the moving averages (EMA 10, 20, 50). Volume analysis points to a “Where’s the Volume?” zone before the breakout. A mini fundamental dashboard displays quarterly financials and sector statistics, providing a holistic setup for position or swing traders.
免責聲明
這些資訊和出版物並不意味著也不構成TradingView提供或認可的金融、投資、交易或其他類型的意見或建議。請在使用條款閱讀更多資訊。
免責聲明
這些資訊和出版物並不意味著也不構成TradingView提供或認可的金融、投資、交易或其他類型的意見或建議。請在使用條款閱讀更多資訊。