the detail is shown in the above Chart.
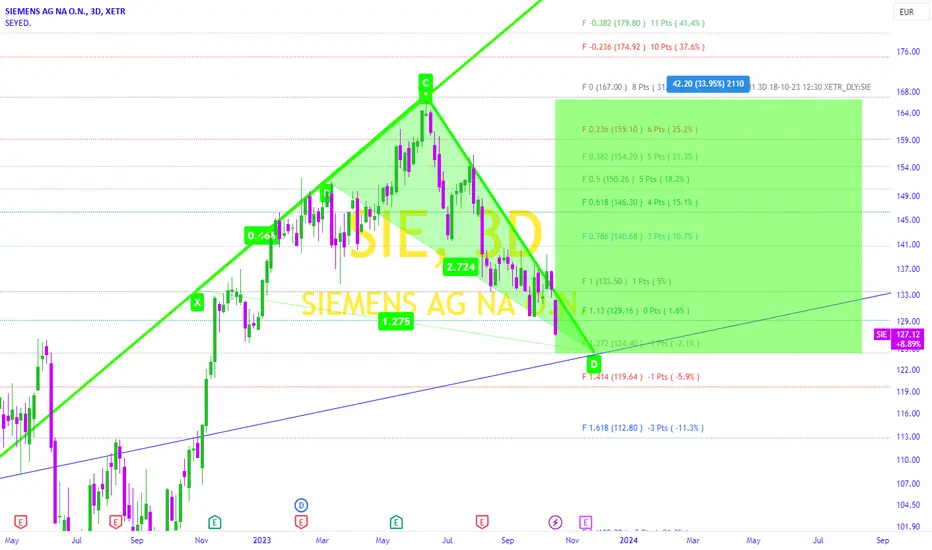
I made this Idea based on Candlestick Analysis and Fibonacci Tool.
Siemens Is Great .
Good luck.
I made this Idea based on Candlestick Analysis and Fibonacci Tool.
- The Buyers' Crab could reach the highest point at the price of 167 euros.
- The Bearish trend started and siemens flag is falling and approaching to the golden level of buyers crab .
- The past trend of sellers' candles has formed a motivated green butterfly pattern
- So we can expect this young Butterfly to raise the Siemens flag again.
Siemens Is Great .
Good luck.
註釋
Possible Trend of Siemens Butterfly.註釋
The Siemens butterfly is not shown in the above photo So that you can see the Siemens flag flying.
註釋
minor correction at wave #2 started (at 167)交易進行
Siemens In 2025 This idea is based on harmonic patterns and candlestick formations at Fibonacci levels. The targets and Entry Points for this order change along the way, depending on the candlestick patterns.
免責聲明
這些資訊和出版物並不意味著也不構成TradingView提供或認可的金融、投資、交易或其他類型的意見或建議。請在使用條款閱讀更多資訊。
This idea is based on harmonic patterns and candlestick formations at Fibonacci levels. The targets and Entry Points for this order change along the way, depending on the candlestick patterns.
免責聲明
這些資訊和出版物並不意味著也不構成TradingView提供或認可的金融、投資、交易或其他類型的意見或建議。請在使用條款閱讀更多資訊。