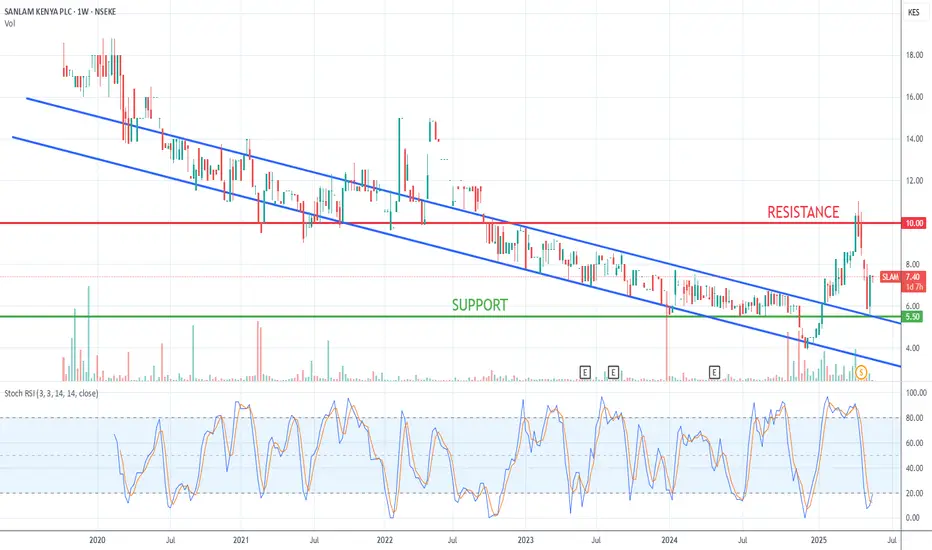
Sanlam has a predictable price action that I have been using to day trade or weekly trade the stock. This is the chart I have used this year to look for entries and exits.
For long-term investors, look at the Stochastic, RSI chart.
Sanlam has the potential for a profitable short-term trade or a promising long-term accumulative stock.
For long-term investors, look at the Stochastic, RSI chart.
Sanlam has the potential for a profitable short-term trade or a promising long-term accumulative stock.
免責聲明
這些資訊和出版物並不意味著也不構成TradingView提供或認可的金融、投資、交易或其他類型的意見或建議。請在使用條款閱讀更多資訊。
免責聲明
這些資訊和出版物並不意味著也不構成TradingView提供或認可的金融、投資、交易或其他類型的意見或建議。請在使用條款閱讀更多資訊。