I’m extremely bullish on SoFi long-term, but the chart is signaling a potential pullback opportunity before the next leg up.
🔹 Technical Breakdown:
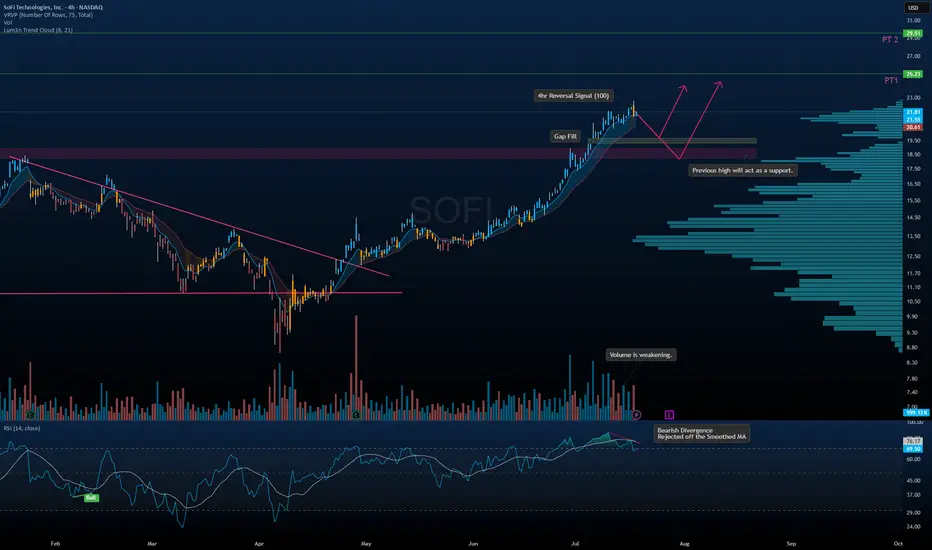
• Bearish Divergence on RSI with rejection off the smoothed MA
• Volume weakening as price moves higher – classic sign of exhaustion
• 4hr Reversal Signal flashing near local highs
• Gap Fill zone near $19.50 + previous highs = strong support zone
• Lum3n Trend Cloud still bullish — trend intact unless breakdown occurs
🎯 Targets:
• PT1 → $23.25
• PT2 → $29.50 (longer-term structure extension)
🧠 Thesis:
Letting price come to us is the smarter move here. I’m watching the $19.50–$20.00 zone closely for potential accumulation. That level has strong confluence with volume shelf, support, and fib structure.
🔹 Technical Breakdown:
• Bearish Divergence on RSI with rejection off the smoothed MA
• Volume weakening as price moves higher – classic sign of exhaustion
• 4hr Reversal Signal flashing near local highs
• Gap Fill zone near $19.50 + previous highs = strong support zone
• Lum3n Trend Cloud still bullish — trend intact unless breakdown occurs
🎯 Targets:
• PT1 → $23.25
• PT2 → $29.50 (longer-term structure extension)
🧠 Thesis:
Letting price come to us is the smarter move here. I’m watching the $19.50–$20.00 zone closely for potential accumulation. That level has strong confluence with volume shelf, support, and fib structure.
免責聲明
這些資訊和出版物並不意味著也不構成TradingView提供或認可的金融、投資、交易或其他類型的意見或建議。請在使用條款閱讀更多資訊。