There are no perfect market indicators. However, traders can increase the chances of success by using two indicators in conjunction.
For the S&P 500 (SPX) combining the Relative Strength Index (RSI) with the Commodity Channel Index (CCI) could be helpful in discovering turns.
Momentum divergences frequently hint of a potential trend reversal. The RSI is one of the best indicators for divergence on stock indices. But what about the times in which the RSI has no momentum divergence? There could still be an index turn that is missed.
Pairing the CCI with the RSI helps to filter out SPX turns that the RSI may not catch.
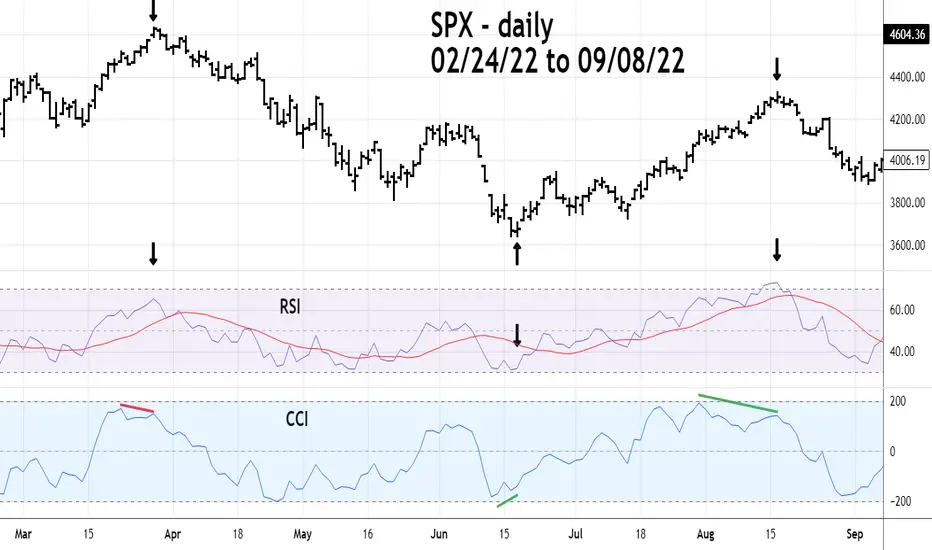
The SPX February to September daily chart shows three examples of when the CCI had divergences while the RSI had none.
Using CCI with RSI on SPX charts could help improve trading and market analysis.
For the S&P 500 (SPX) combining the Relative Strength Index (RSI) with the Commodity Channel Index (CCI) could be helpful in discovering turns.
Momentum divergences frequently hint of a potential trend reversal. The RSI is one of the best indicators for divergence on stock indices. But what about the times in which the RSI has no momentum divergence? There could still be an index turn that is missed.
Pairing the CCI with the RSI helps to filter out SPX turns that the RSI may not catch.
The SPX February to September daily chart shows three examples of when the CCI had divergences while the RSI had none.
Using CCI with RSI on SPX charts could help improve trading and market analysis.
免責聲明
這些資訊和出版物並不意味著也不構成TradingView提供或認可的金融、投資、交易或其他類型的意見或建議。請在使用條款閱讀更多資訊。
免責聲明
這些資訊和出版物並不意味著也不構成TradingView提供或認可的金融、投資、交易或其他類型的意見或建議。請在使用條款閱讀更多資訊。