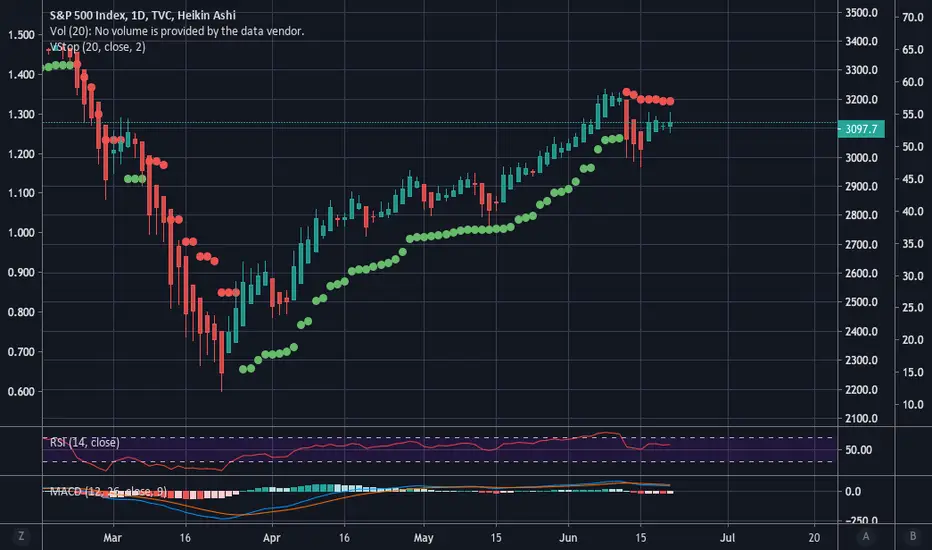
The daily chart using Heikin Ashi candles with volatility stops indicates that the trend changed to a downtrend last Thursday. A reasonable move back up would stop out these trending chart indicators, but they can be useful for longer-term trades. For instance, as you can see in the chart, had you traded off of these alone, you would have gone long on March 25th until last Thursday.
免責聲明
這些資訊和出版物並不意味著也不構成TradingView提供或認可的金融、投資、交易或其他類型的意見或建議。請在使用條款閱讀更多資訊。
免責聲明
這些資訊和出版物並不意味著也不構成TradingView提供或認可的金融、投資、交易或其他類型的意見或建議。請在使用條款閱讀更多資訊。