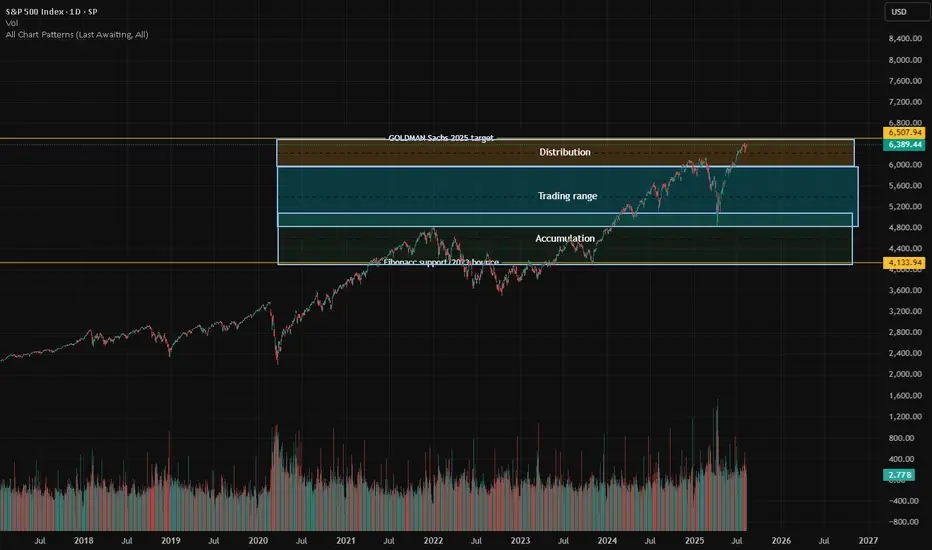
Fibonacci-Based Zones: The chart is structured around support and resistance zones derived from Fibonacci analysis, providing natural levels for market reaction.
Accumulation Zone: Lower price area (~4,133.94 and above) where buyers show interest and trend reversal is often seeded.
Trading Range: The broad mid-section where price is expected to oscillate, indicating indecision or equilibrium among buyers and sellers.
Distribution Zone: Upper price band near the Goldman Sachs 2025 target, as marked, where profit-taking and seller interest increases.
Potential for Parabolic Move: If price decisively breaks out above the distribution/resistance zone, it could trigger rapid, euphoric buying—a classic market melt-up.
Risk of Downside: Falling below the key Fibonacci support level could prompt a sharp correction,.
Historical Validation: Past price movements respect these zones.
免責聲明
The information and publications are not meant to be, and do not constitute, financial, investment, trading, or other types of advice or recommendations supplied or endorsed by TradingView. Read more in the Terms of Use.
免責聲明
The information and publications are not meant to be, and do not constitute, financial, investment, trading, or other types of advice or recommendations supplied or endorsed by TradingView. Read more in the Terms of Use.