The 15-year cycle from 2008 to 2023 SP500
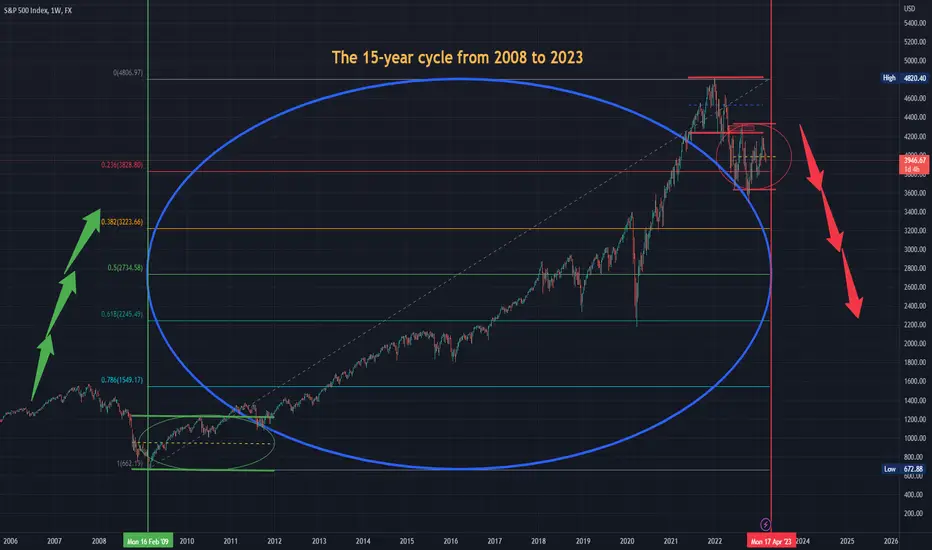
The 15-year cycle from 2008 to 2023, which fits perfectly into a sphere and a square on fibo rate levels. Technical analysis of price actions with accumulation and distribution sequences
The 15-year cycle from 2008 to 2023, which fits perfectly into a sphere and a square on fibo rate levels. Technical analysis of price actions with accumulation and distribution sequences
免責聲明
這些資訊和出版物並不意味著也不構成TradingView提供或認可的金融、投資、交易或其他類型的意見或建議。請在使用條款閱讀更多資訊。
免責聲明
這些資訊和出版物並不意味著也不構成TradingView提供或認可的金融、投資、交易或其他類型的意見或建議。請在使用條款閱讀更多資訊。